Google Looker Studio Integration
Google Looker Studio is a free online tool for converting data into visual dashboards and reports. The IQM Reports custom connector provides a way to import your IQM ad-serving reporting data into Google Looker Studio, where it can be used to create visualizations.
Prerequisites
Before using the IQM Reports connector, you must have:
- An active IQM account with API access
- A Google account
Setup
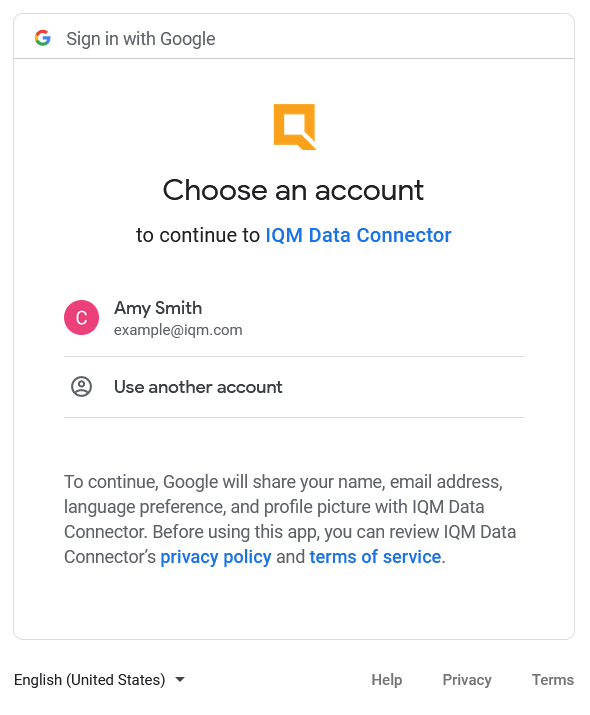
Step 1: Select the IQM Reports Connector
- Navigate to the IQM Reports Connector Page
- Click the Authorize button and select your Google account in the "Choose an Account" popup
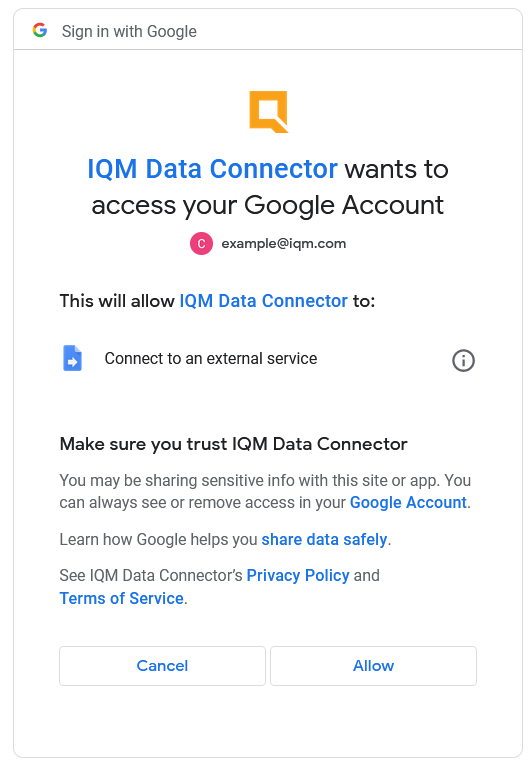
Step 2: Authorize Access
When prompted, click Allow to allow the connector to connect to your Google account.
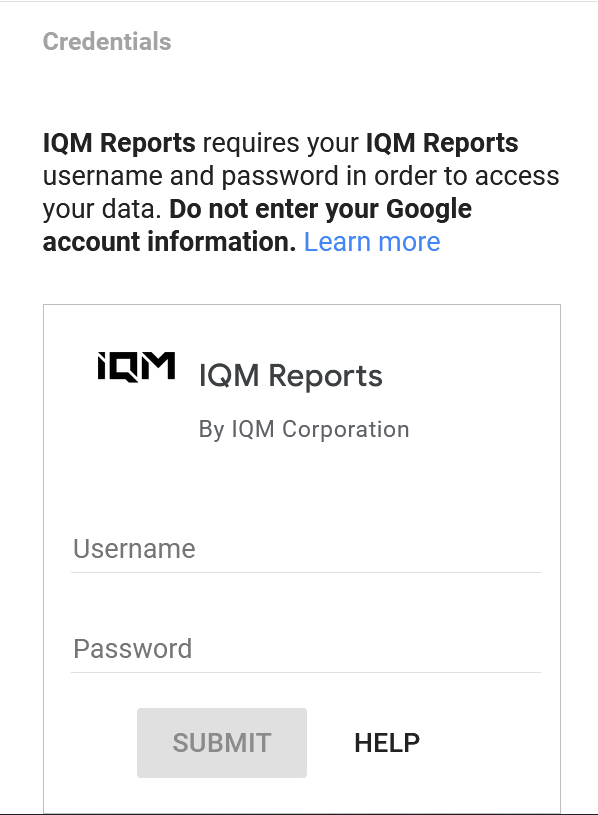
Step 3: Enter Credentials
- Under Credentials, enter your IQM account credentials (email and password)
- Click Submit
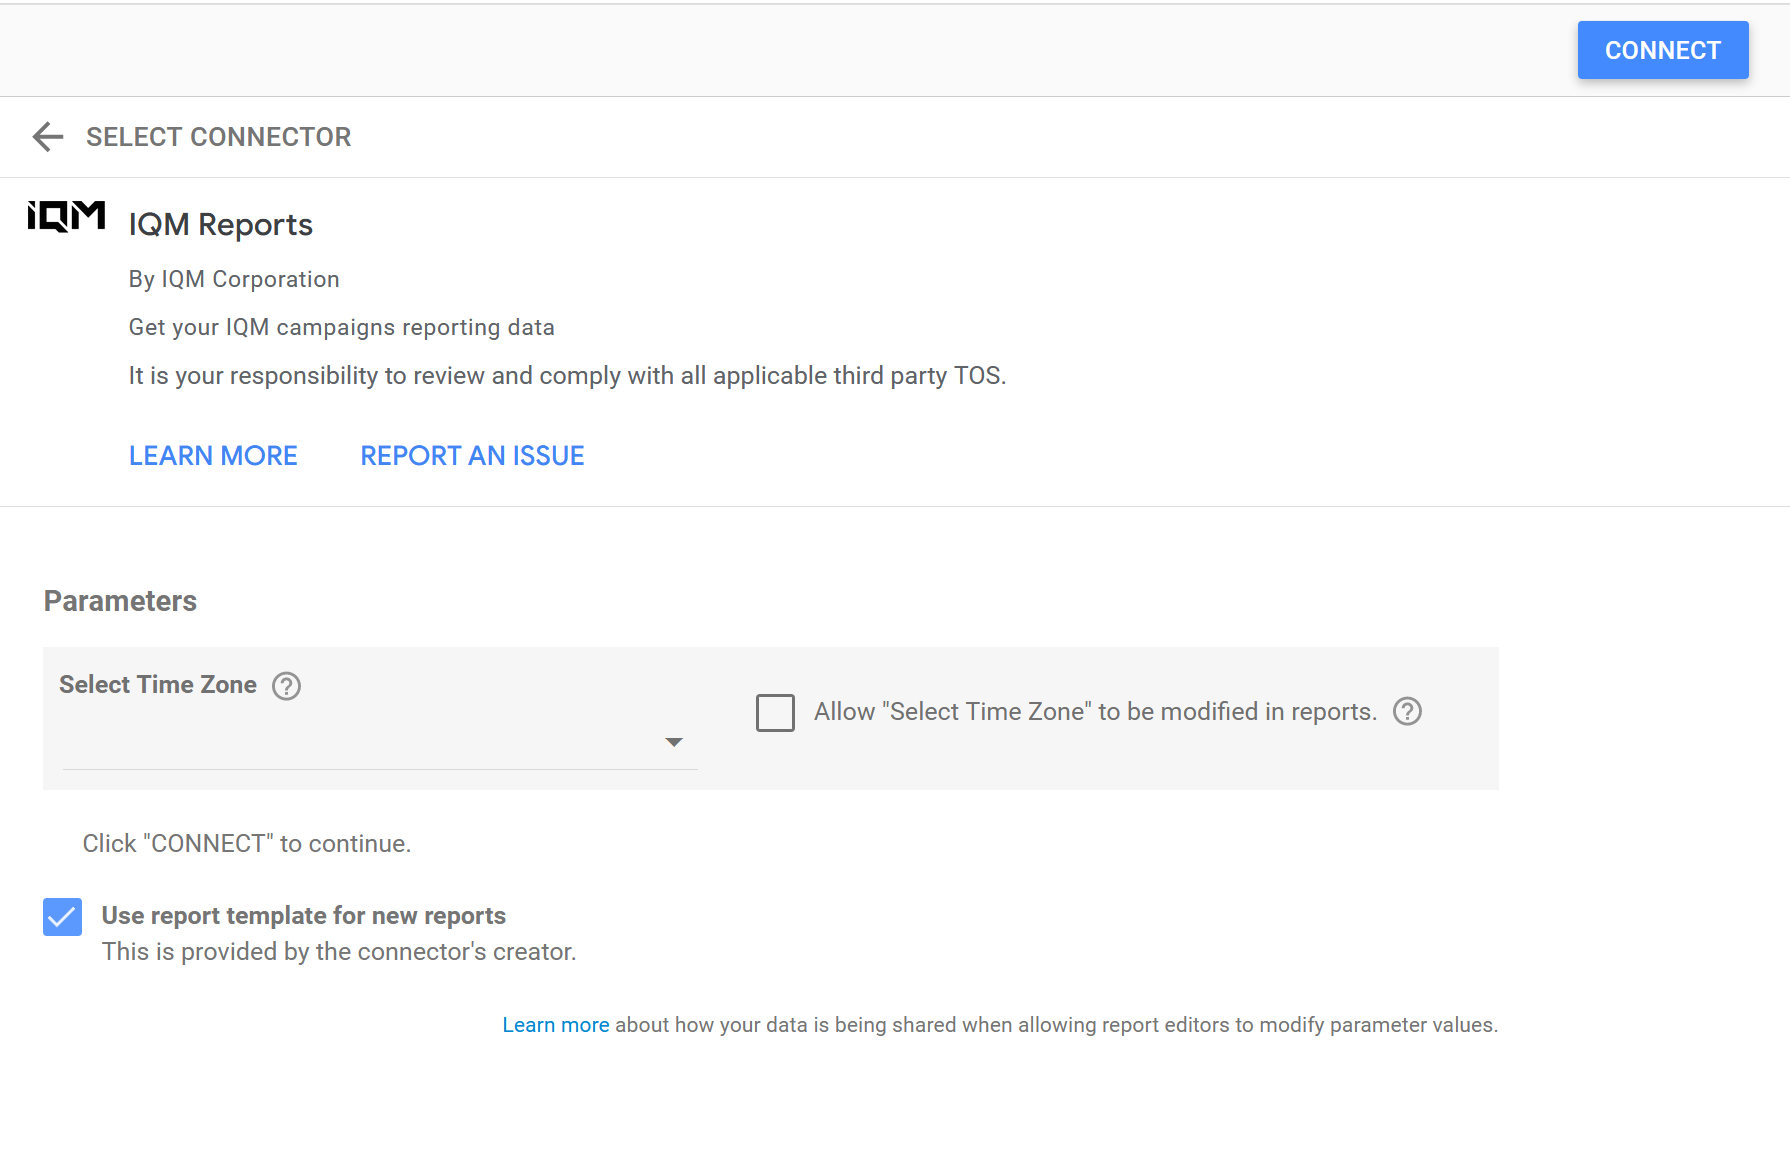
Step 4: Configure Parameters
- Under Parameters, select the time zone that should be used for dates when viewing the reporting data
- To start your visual report with the default report template, keep the Use report template for new reports option checked. This template provides an editable default visual report to view your data
- In the top right corner, click Connect
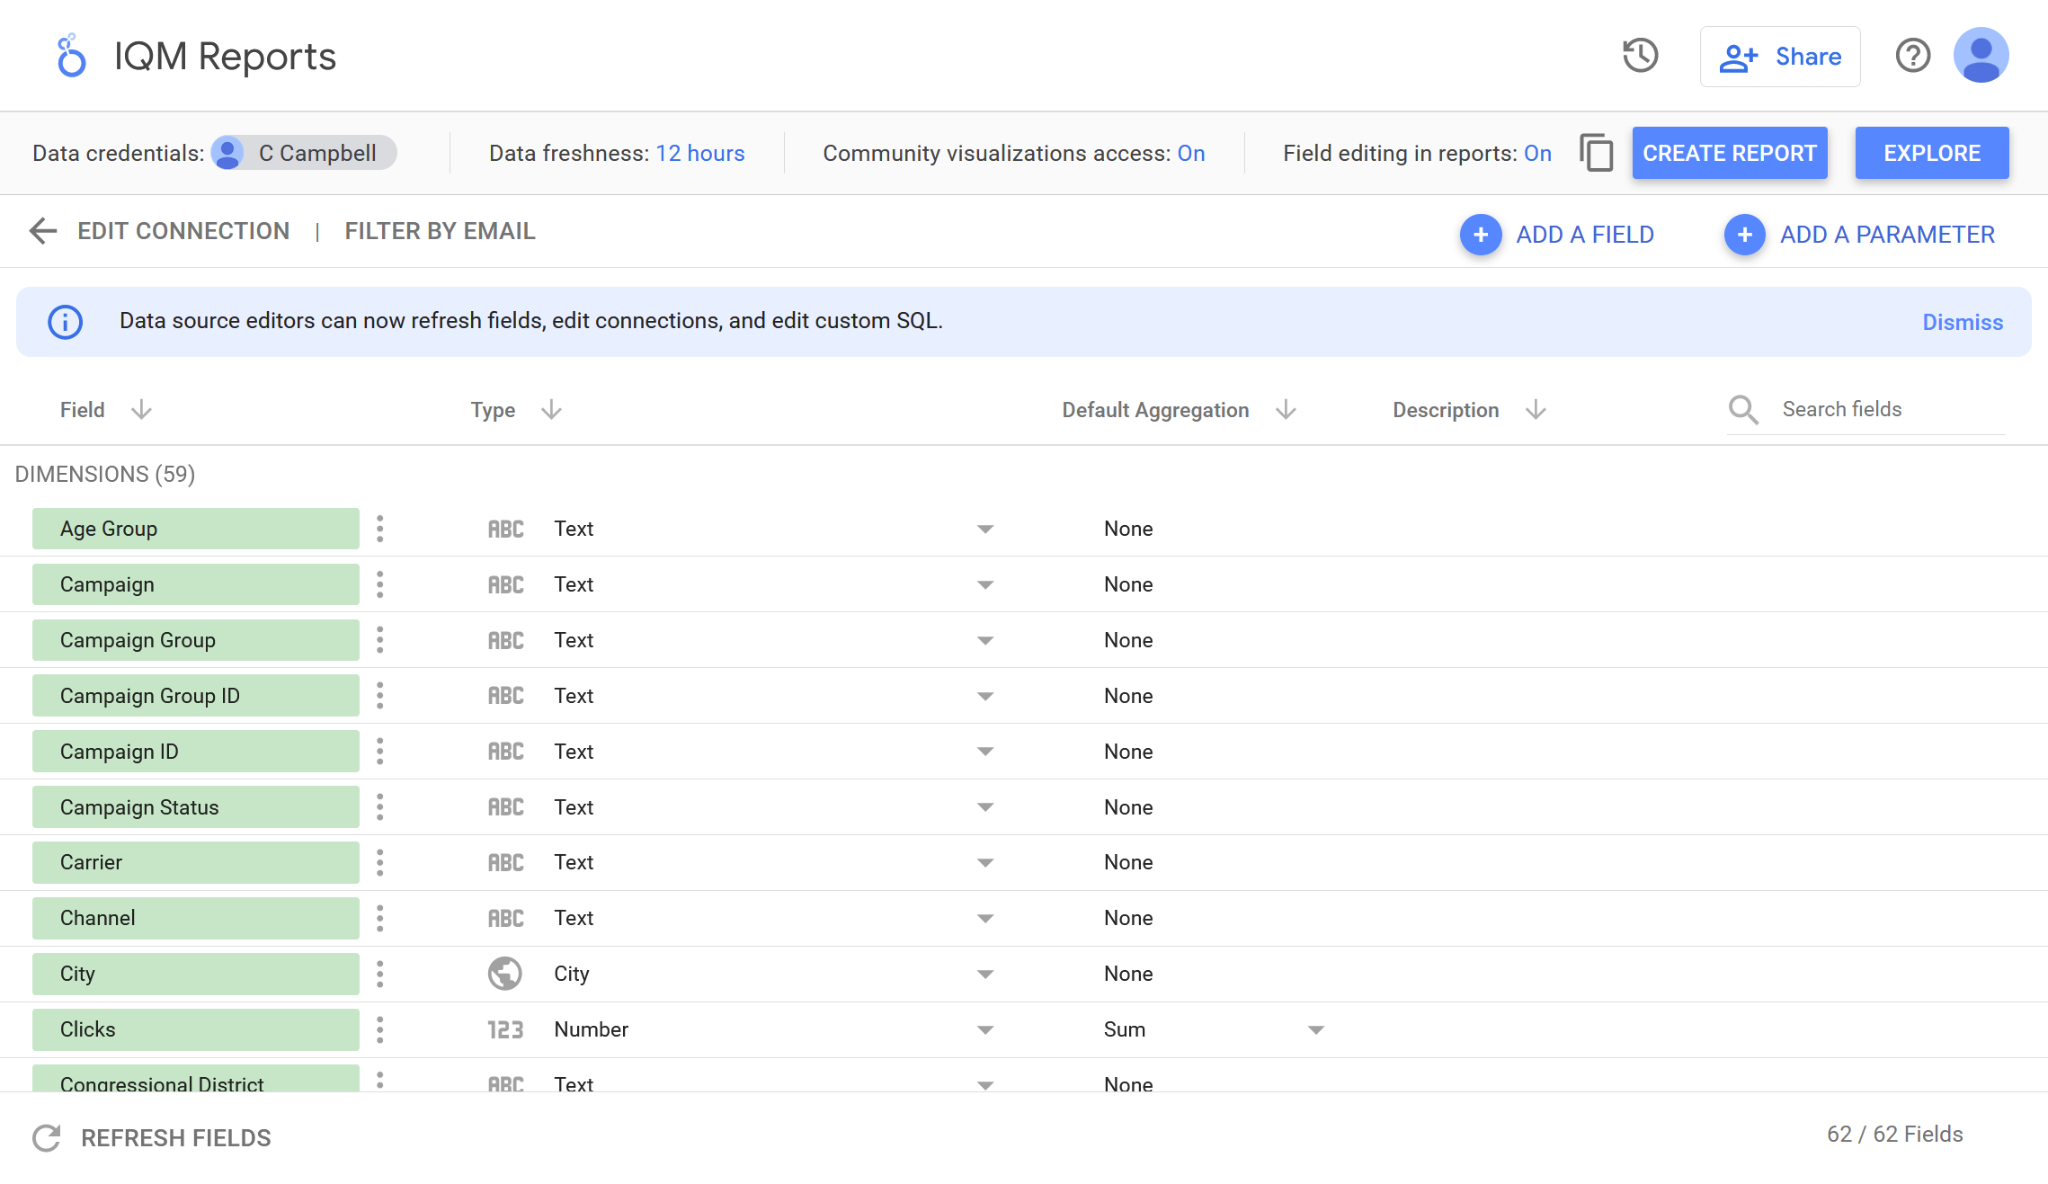
Step 5: Create Your Report
- On the following page, you'll see a list of data fields (dimensions) provided by the connector
- Click Create Report to continue
- You'll be directed to either:
- A blank report connected to your IQM data (if template option was unchecked)
- A report using the default report template (if template option was checked)
For more information about building visual reports in Google Looker Studio, refer to the official Google Looker Studio Documentation.
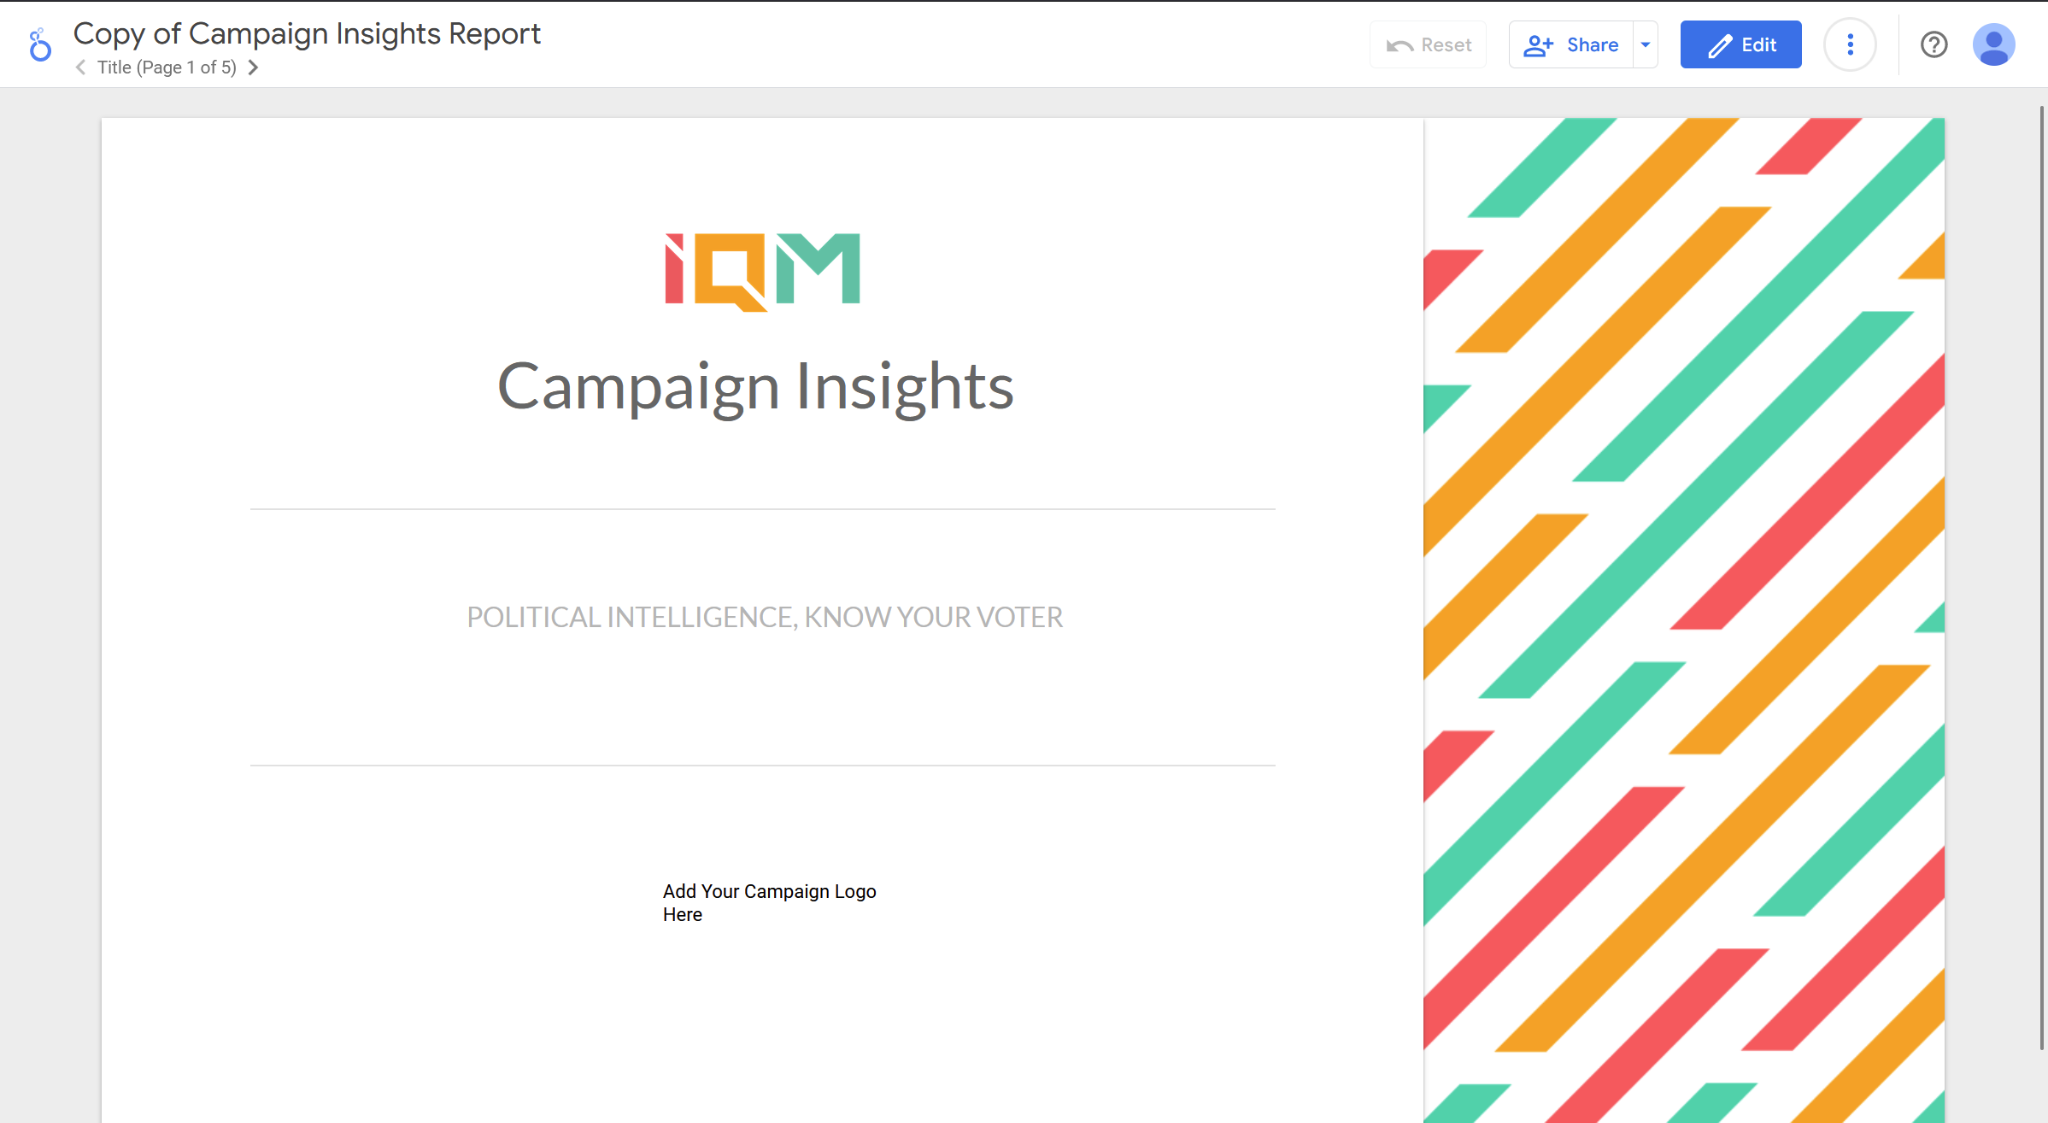
Using the Default Report Template
The report template provides an editable default dashboard to display your IQM ad-serving data.
Navigating the Report
To view different pages of the default report, click the arrows below the report title at the top of the page.
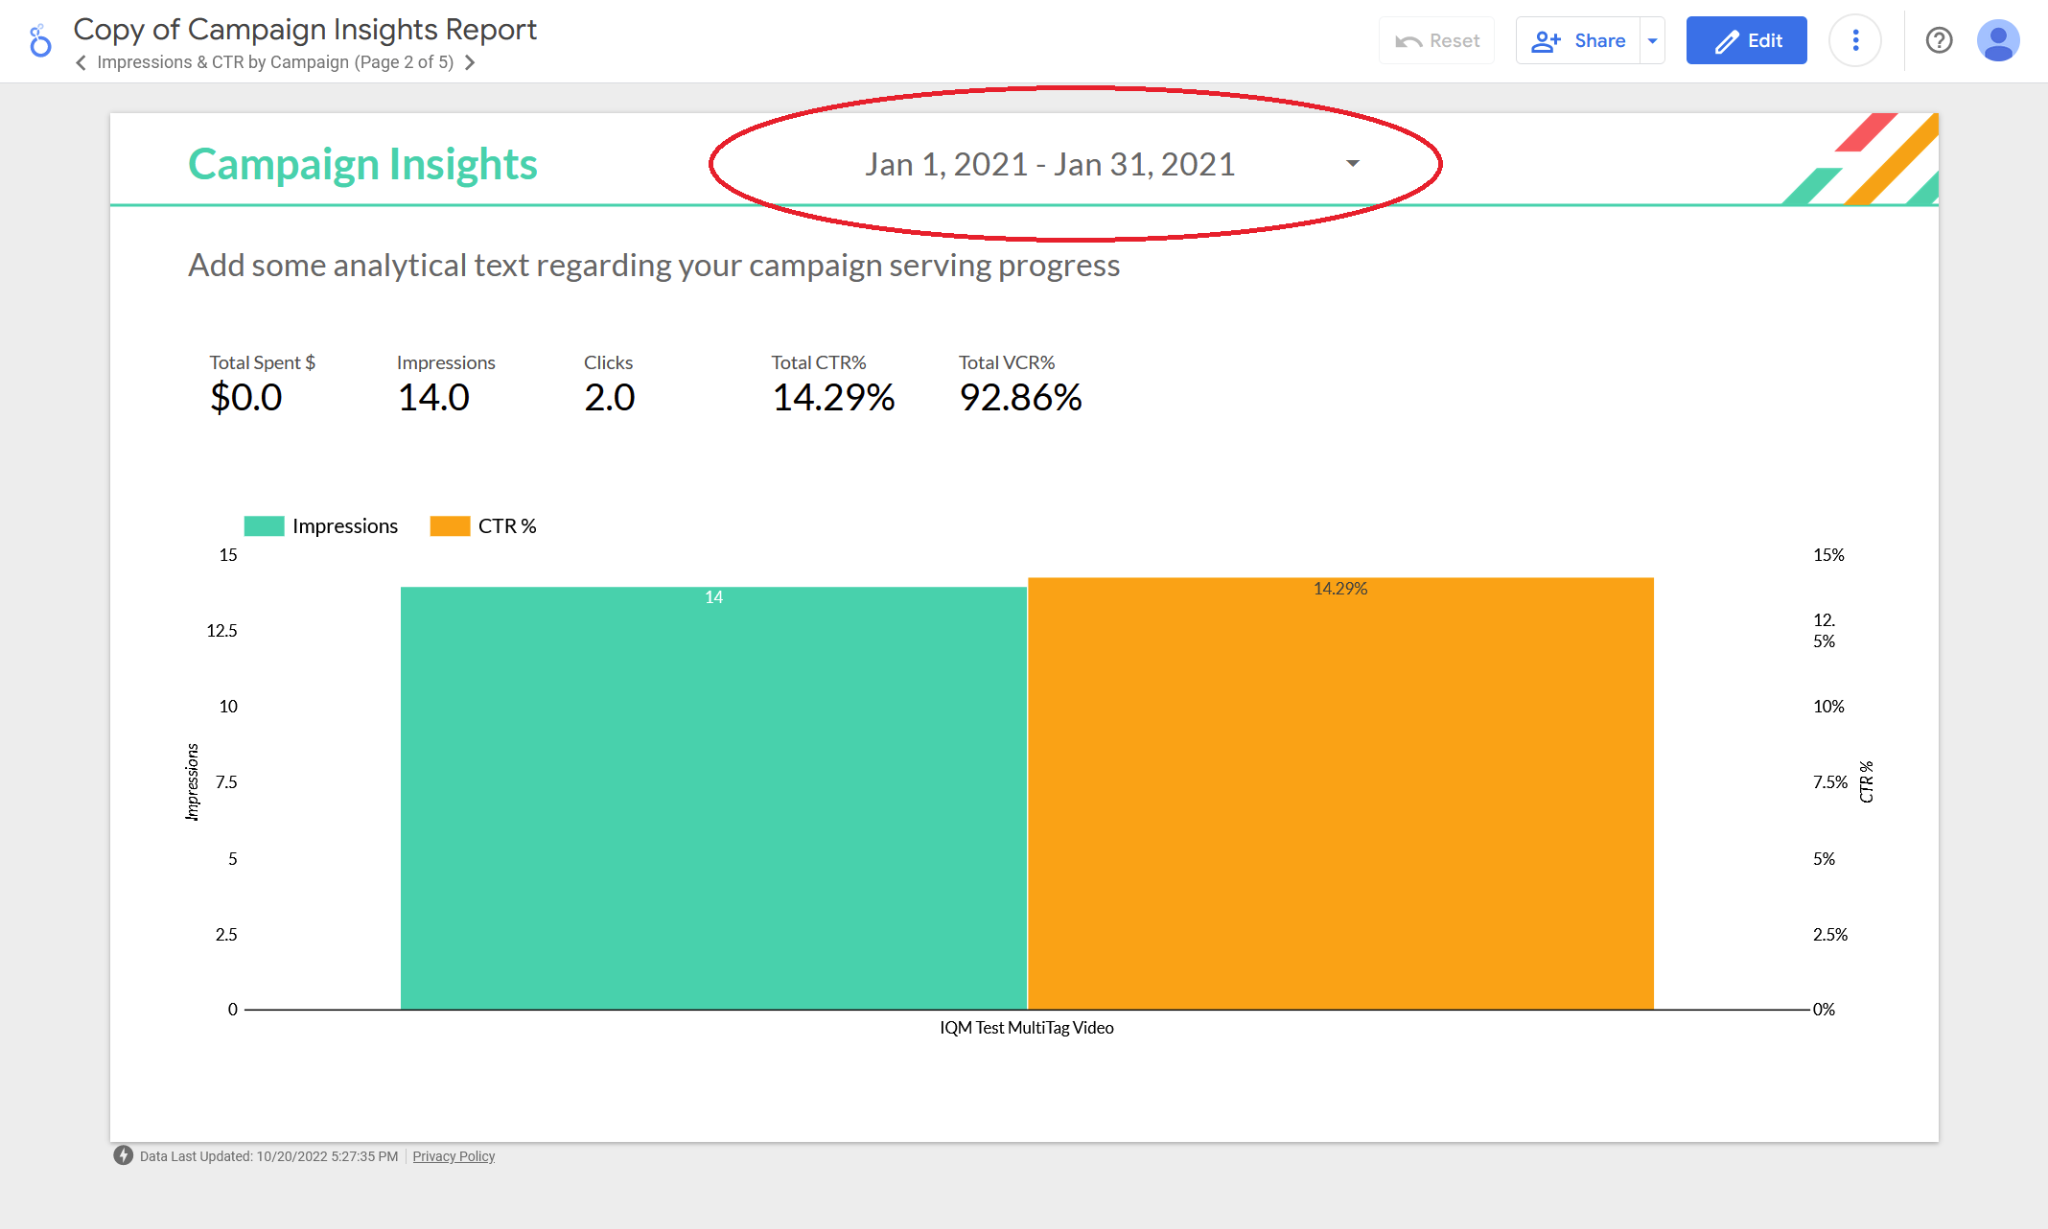
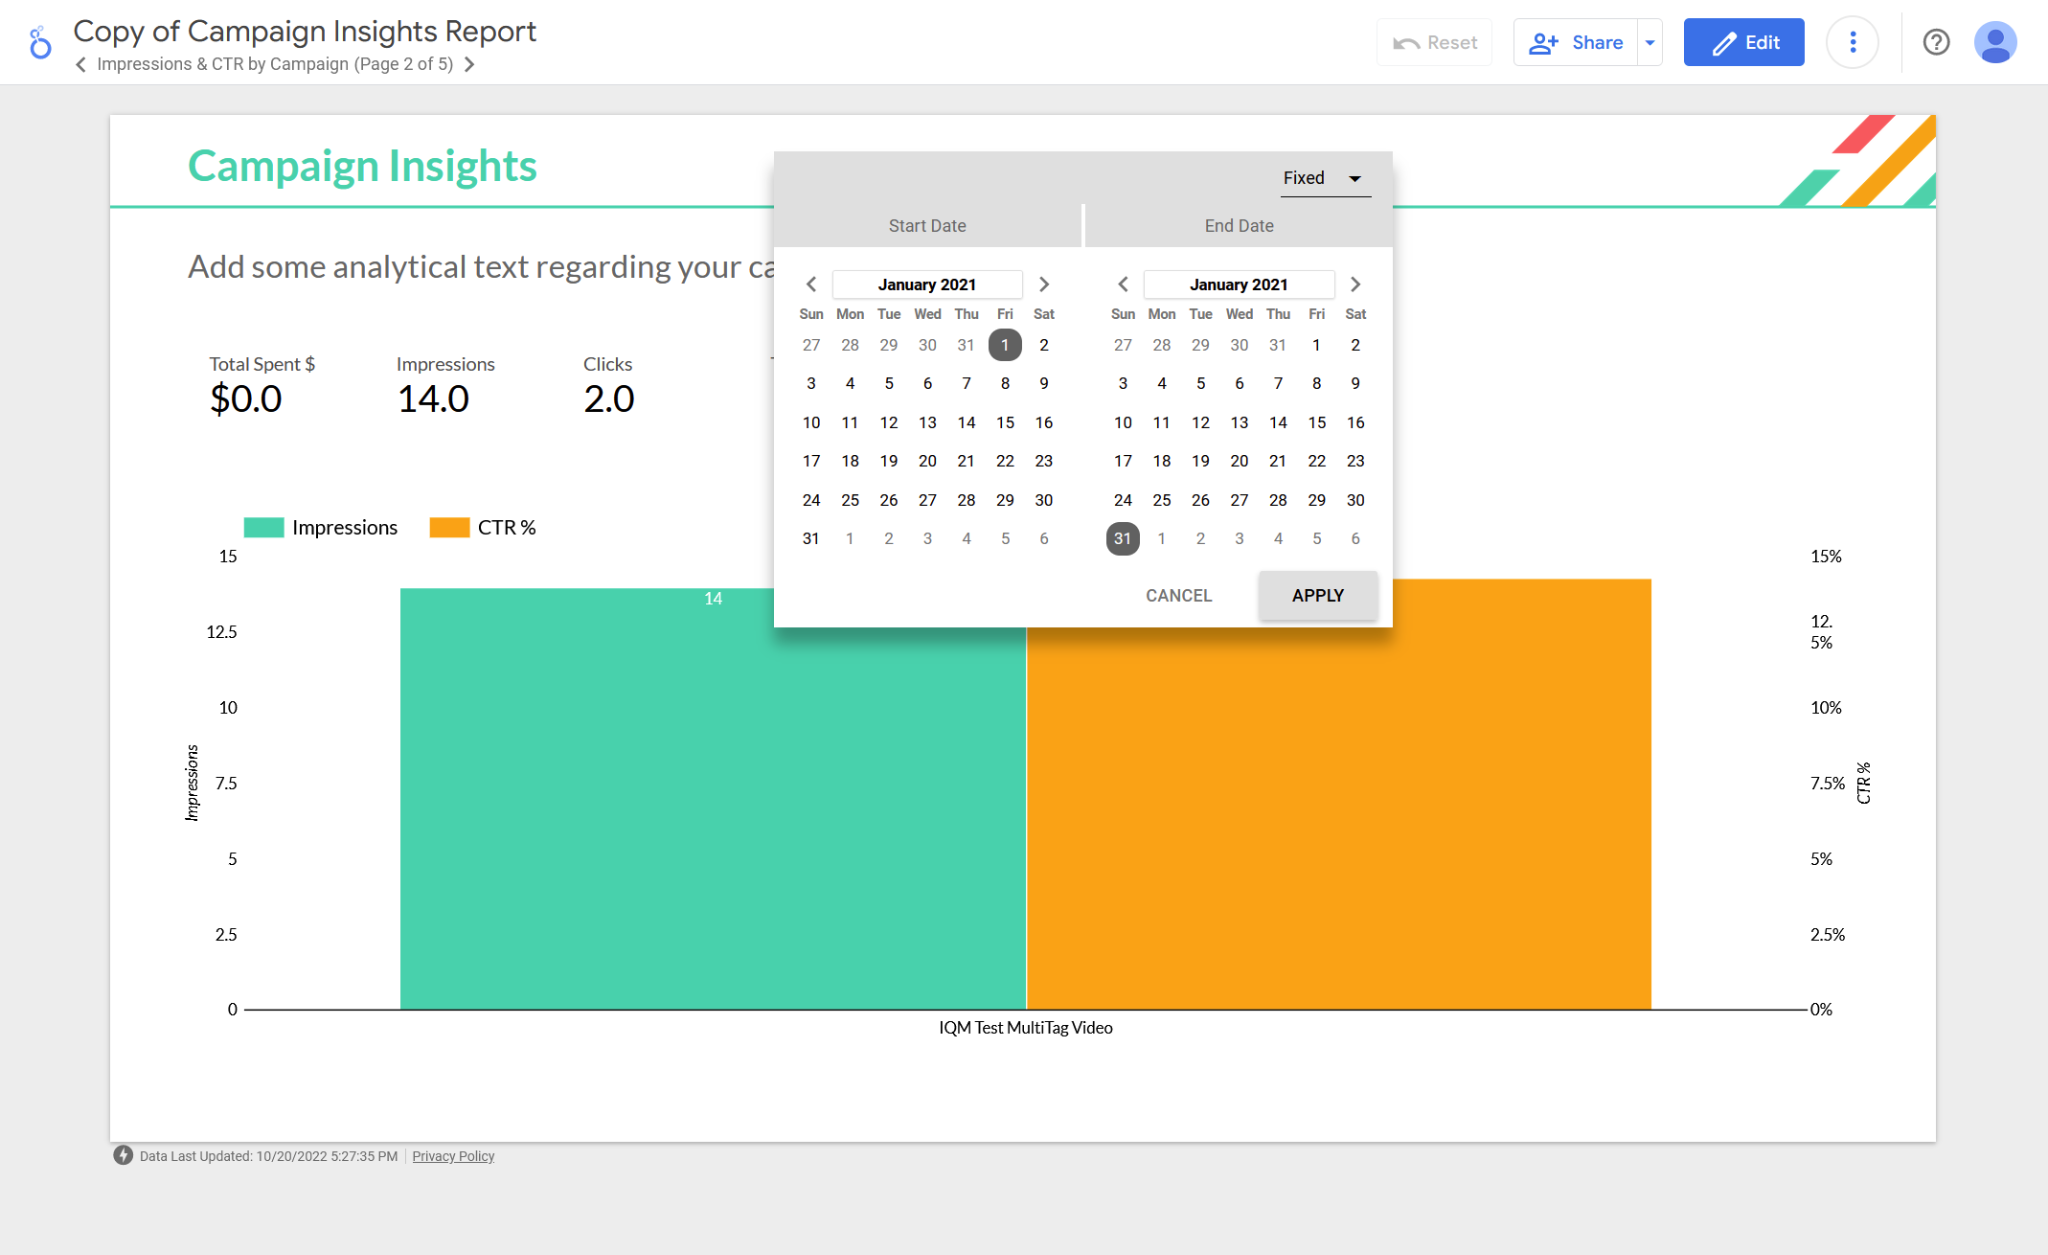
Changing the Date Range
- Click the date dropdown and select a new date range
- This modifies the data loaded into all charts and visuals in the report
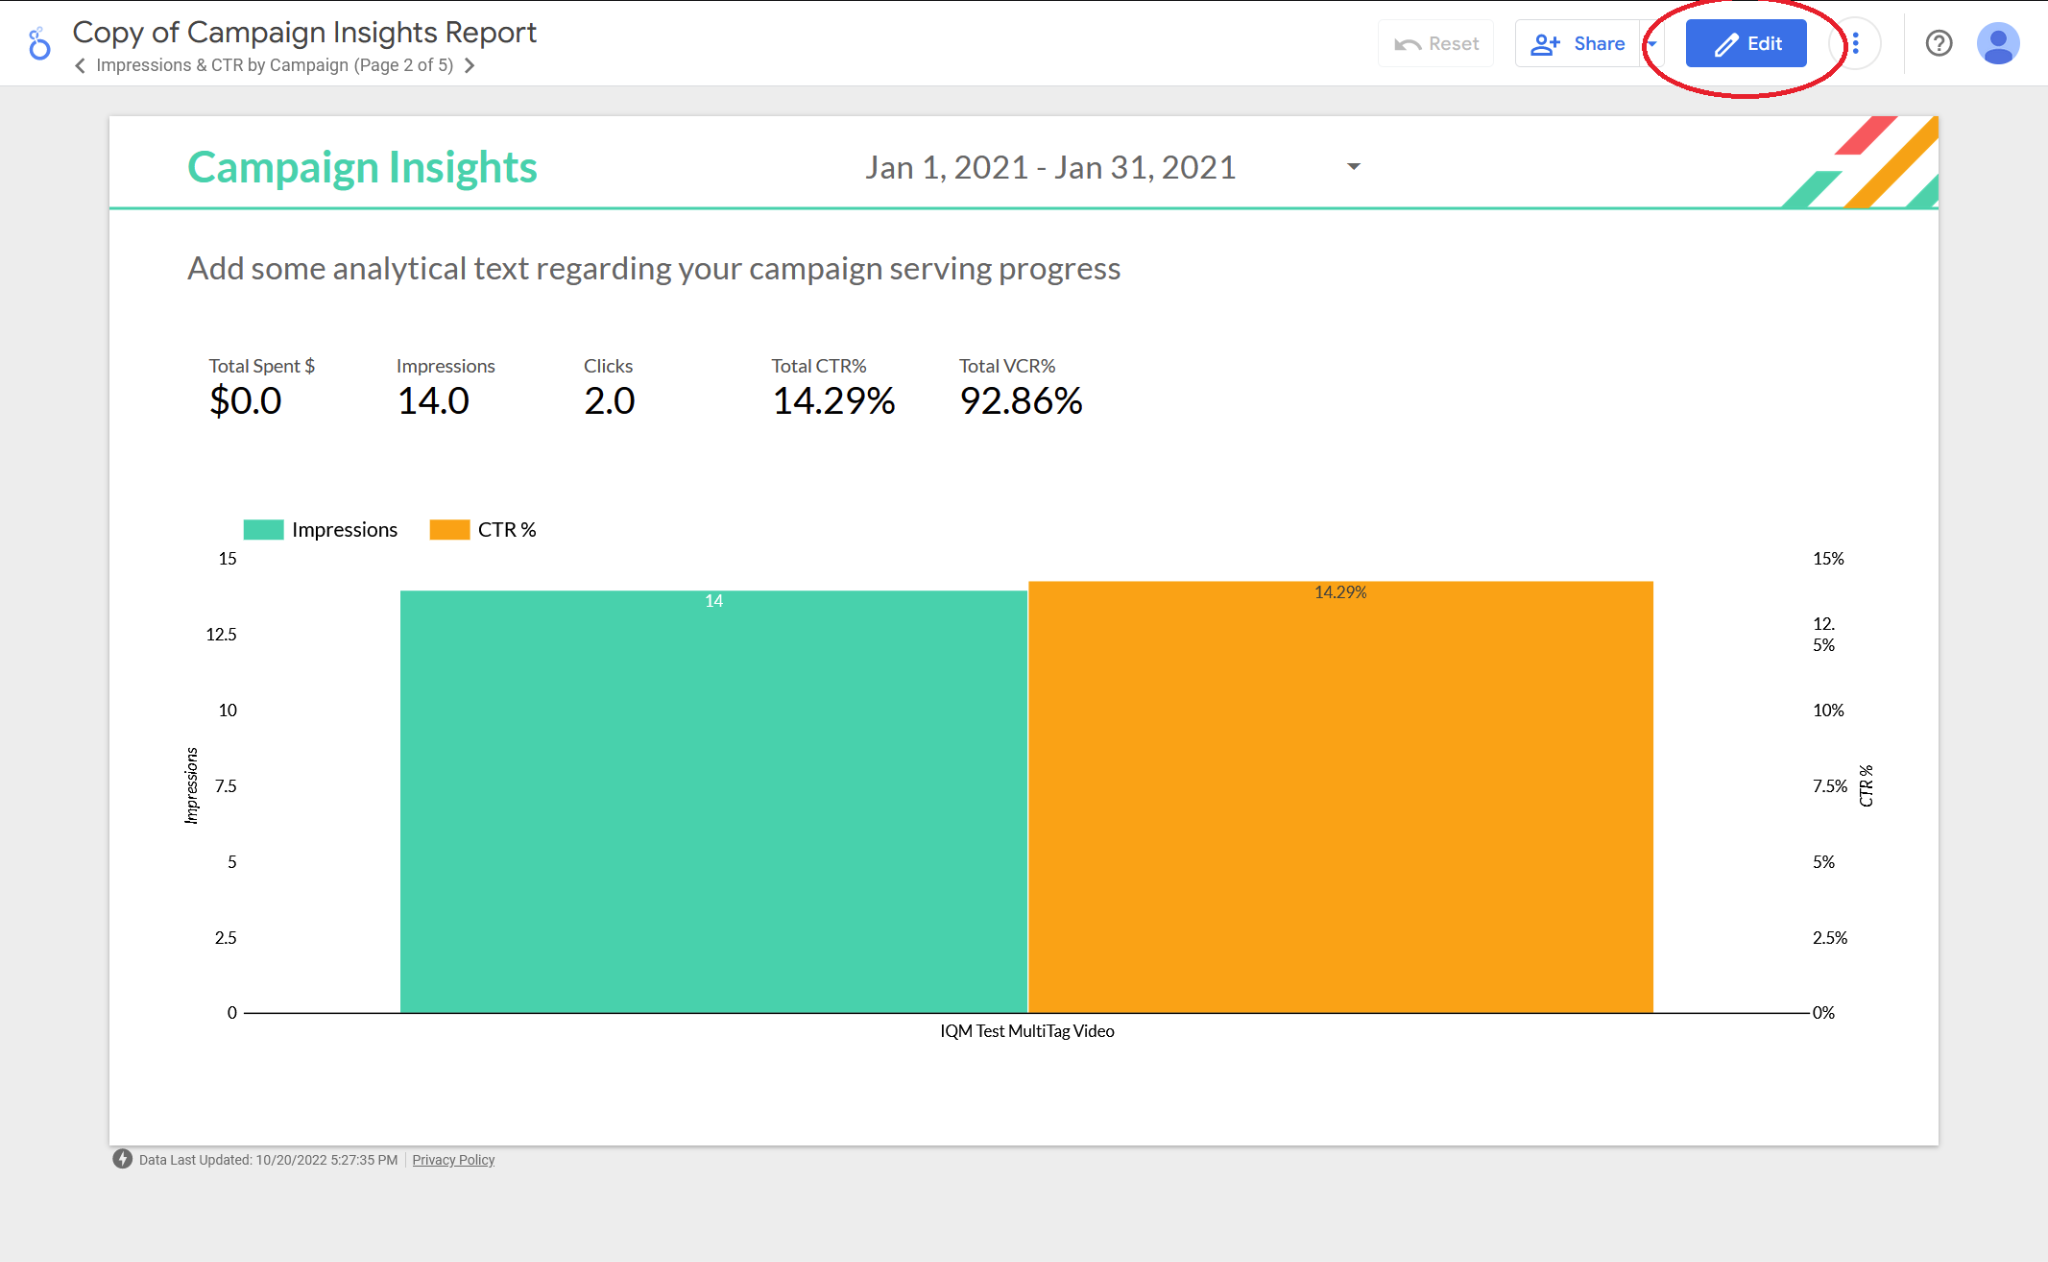
Editing the Report
- Click the Edit button at the top-right of the page
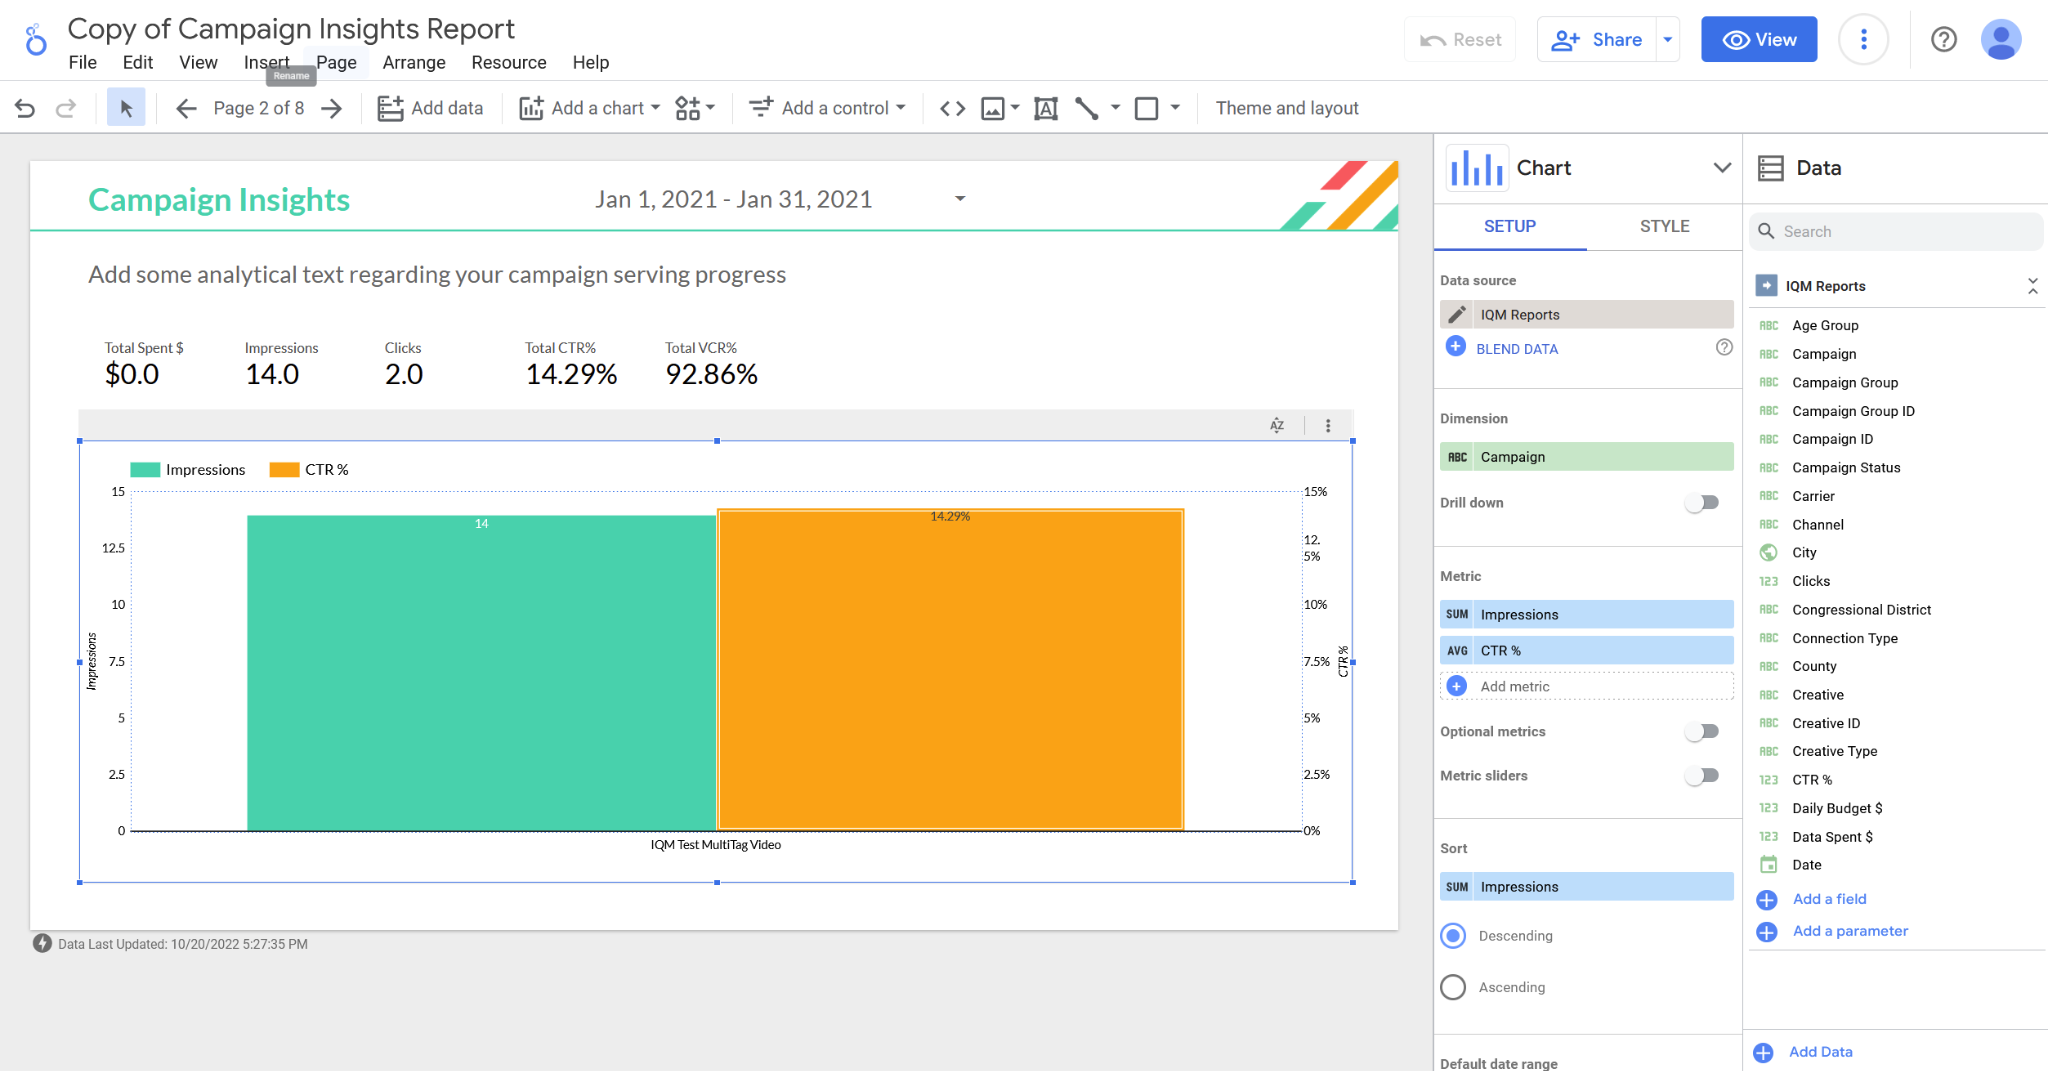
- To edit a specific chart or visualization, click on it to open the related properties panel
- In the properties panel, you can modify:
- The dimension that data is grouped by (Campaigns, Creatives, congressional districts, etc.)
- The metrics displayed in the chart (impressions, clicks, win rate, etc.)
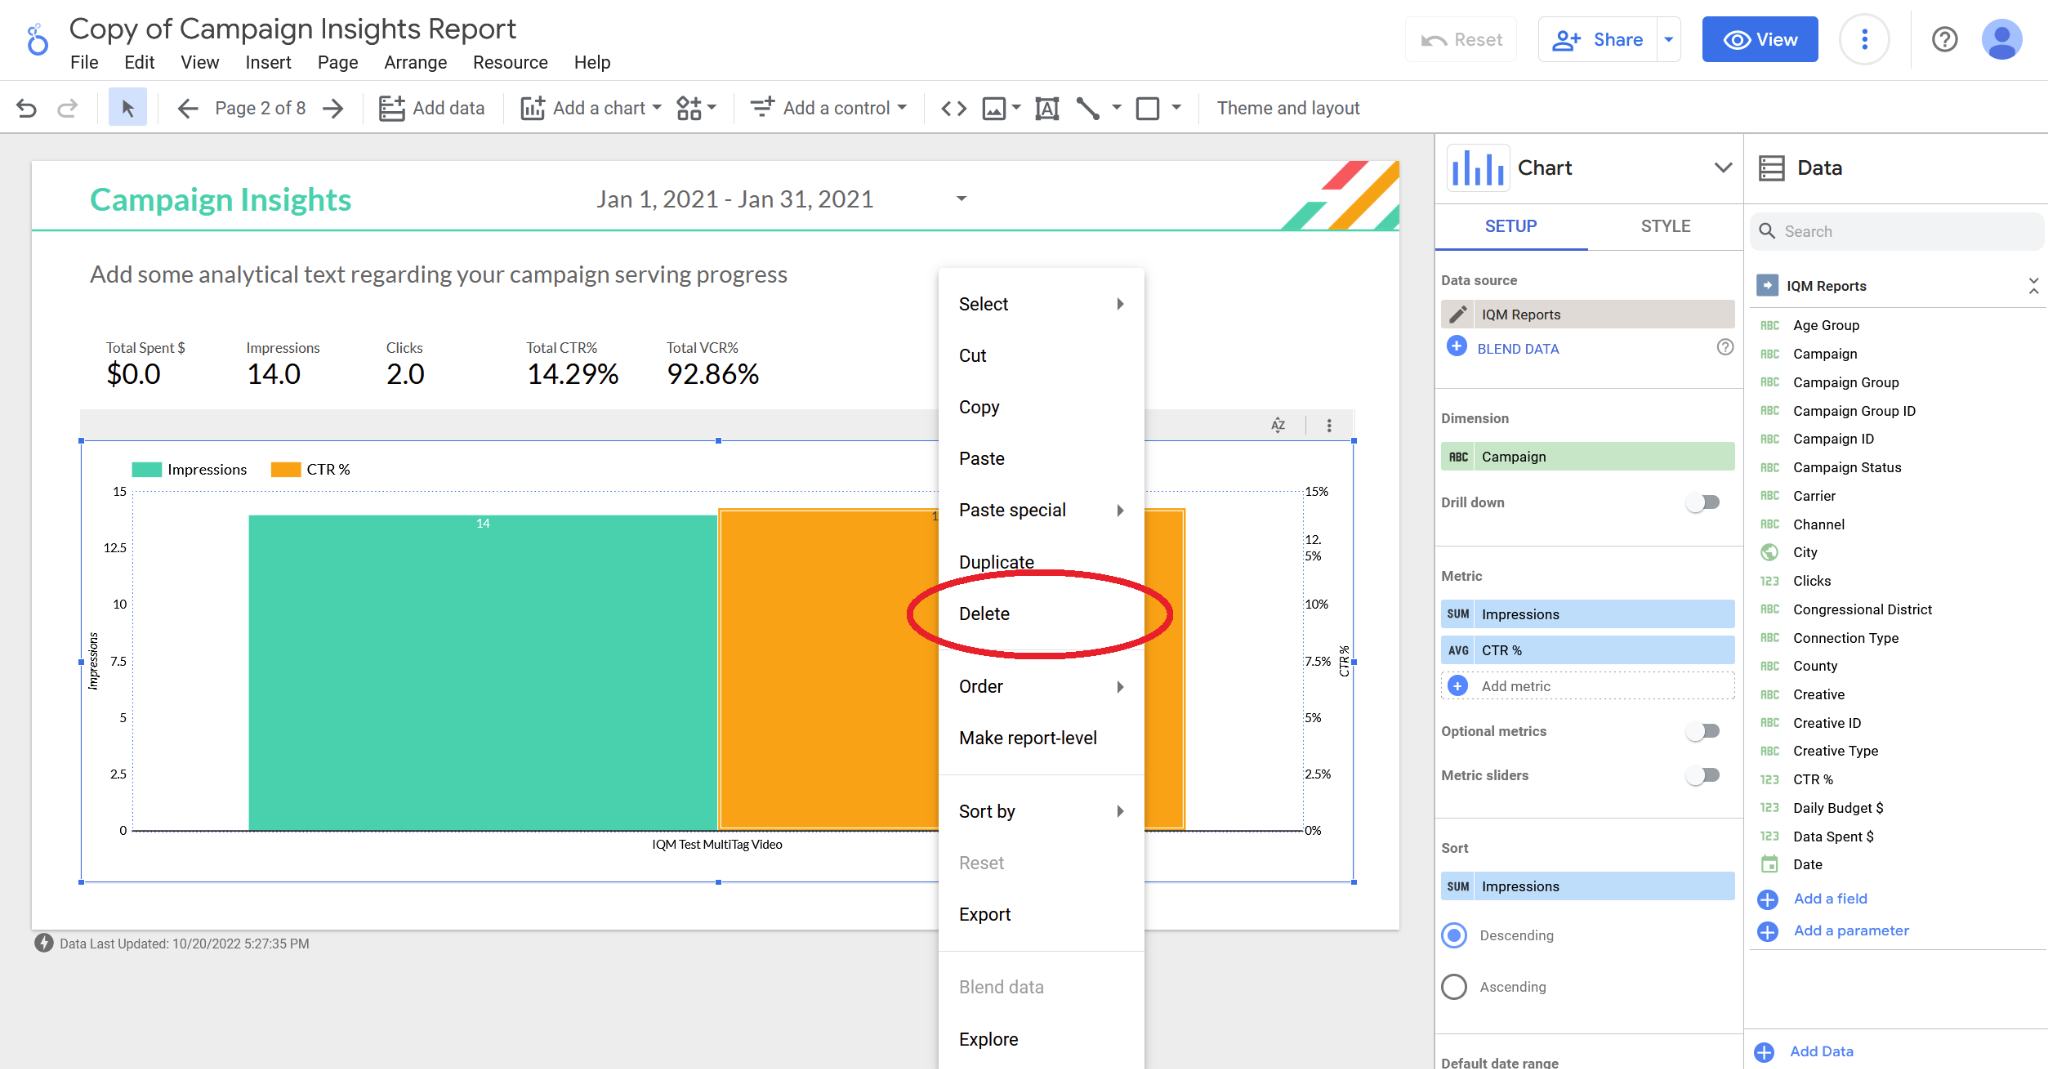
Removing Visual Components
- Right-click on the component you want to remove
- Select Delete from the pop-up menu
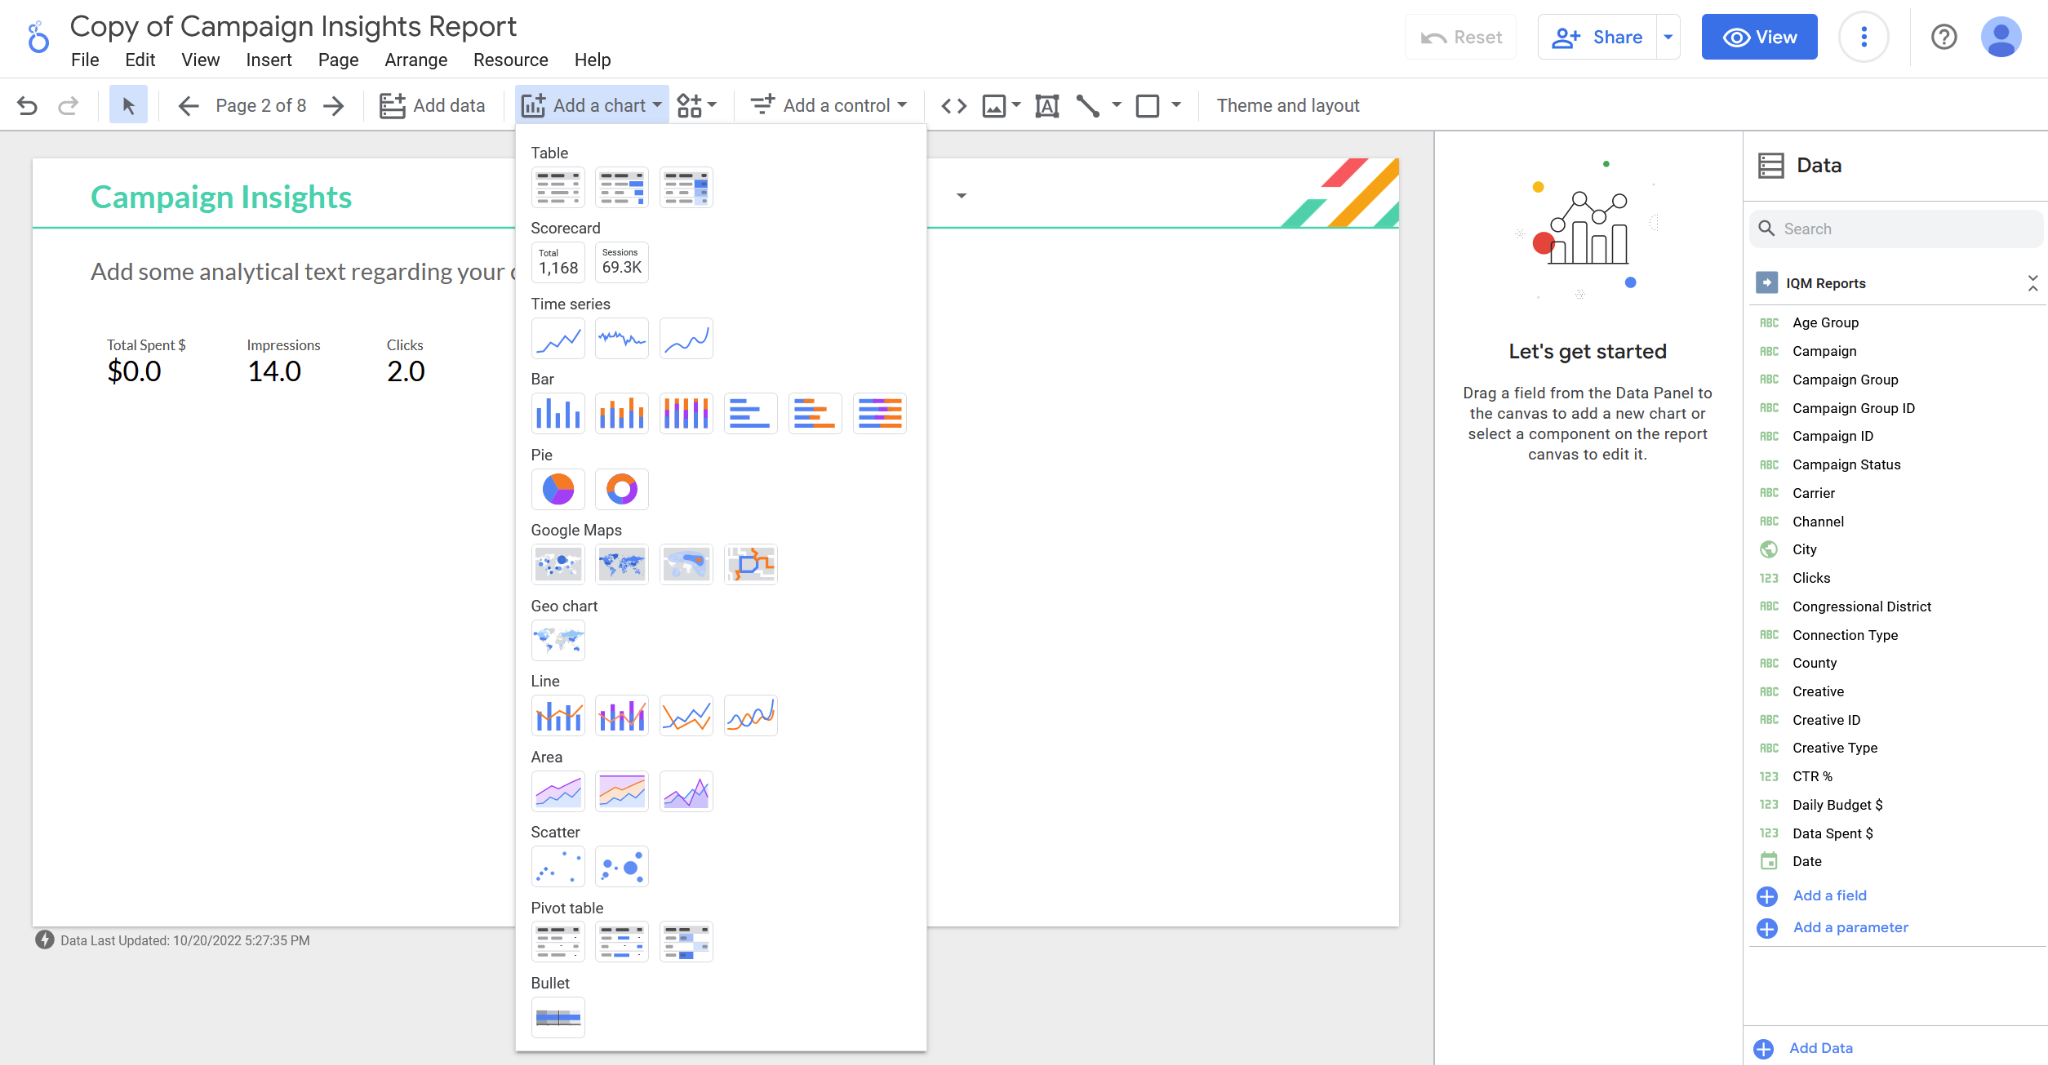
Adding Visual Components
- Click Add a Chart from the toolbar
- For more information about each chart type, see Google's Chart Documentation
- Select metrics and dimensions from the properties panel on the right
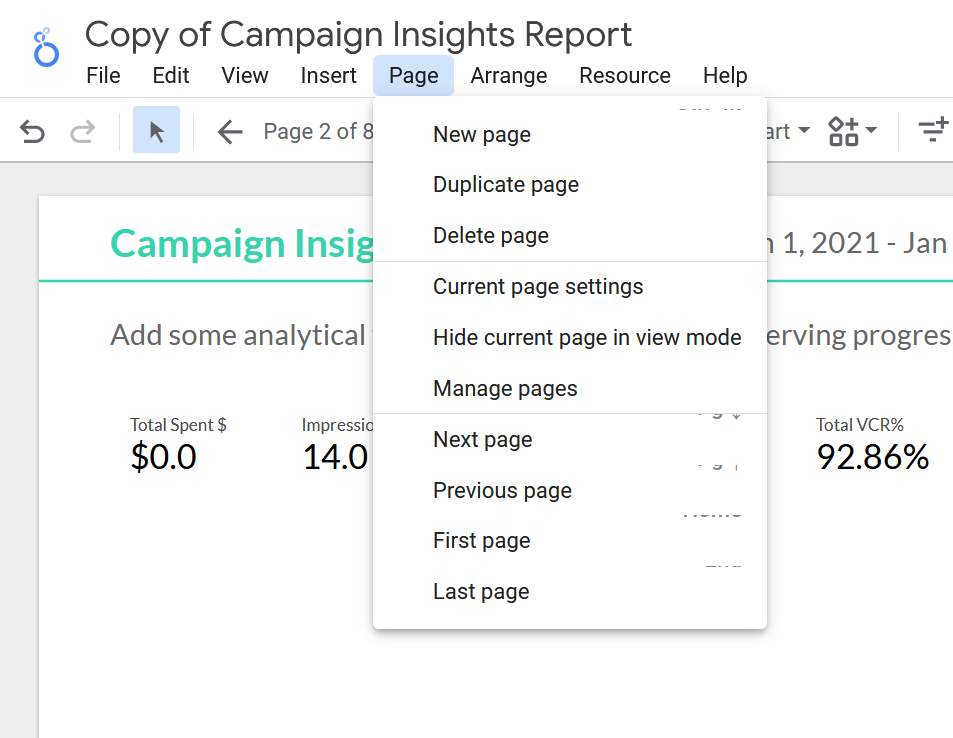
Adding New Pages
Select Page > New Page from the toolbar at the top.
Sharing the Report
You can share the reports you create with Looker Studio with other people.
Best Practices for Sharing
Before sharing your report:
- Include only information relevant to the recipient
- If you run Campaigns for multiple clients, include only Campaigns for the specific client you're sharing with
- Consider creating a new data source for each report you plan to share
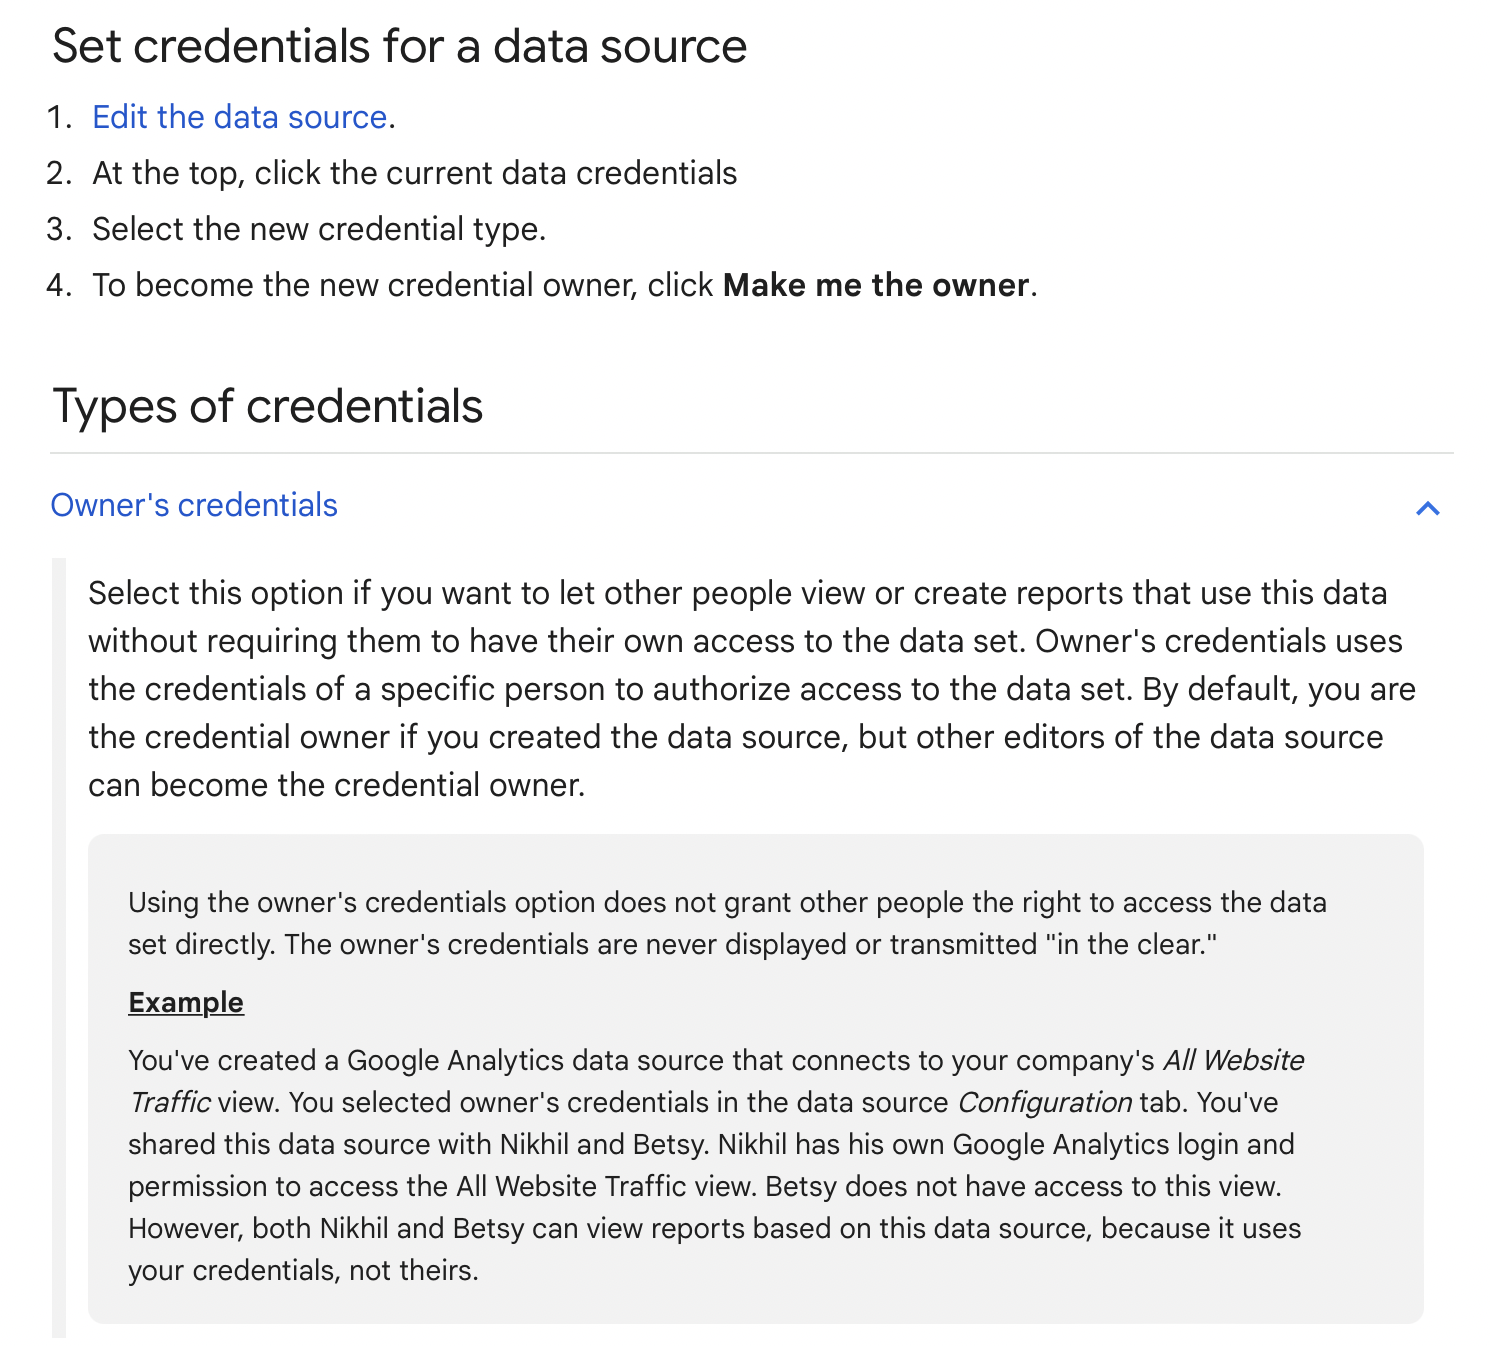
Data Credentials Options
If you don't want people you share a report with to be asked to input IQM platform credentials, use Owner's credentials as the report Data Credentials as described in Google Looker Studio Help.
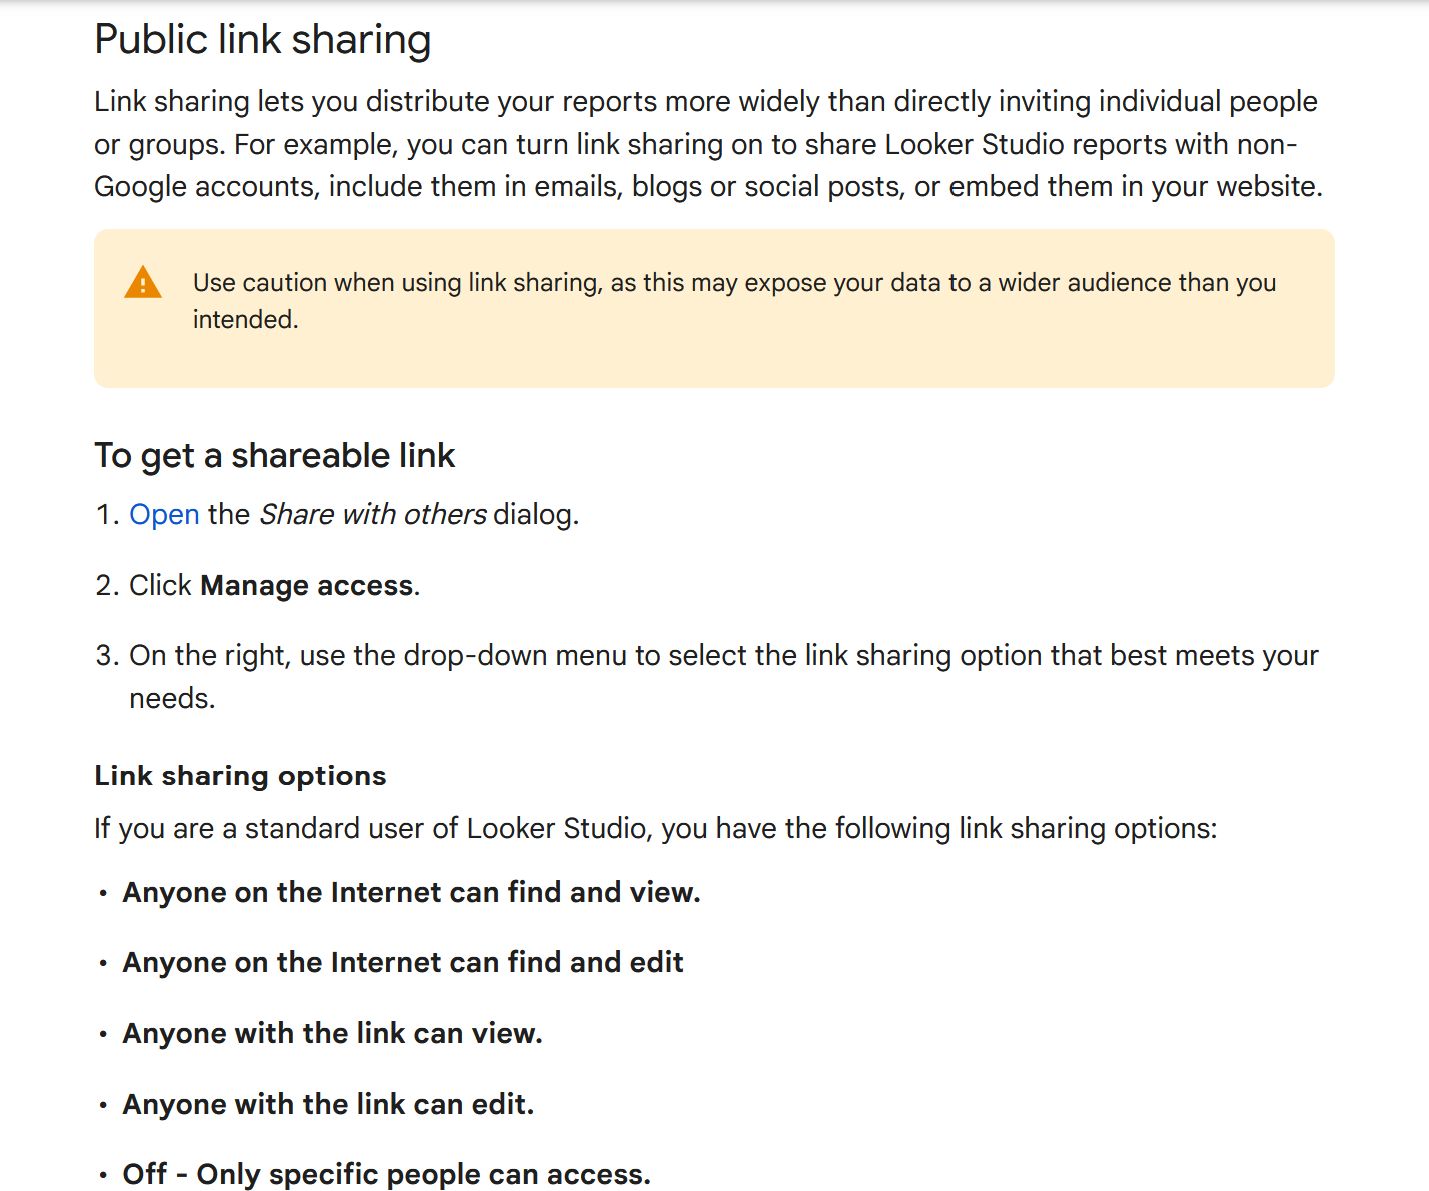
Public Sharing
If you don't want recipients to be asked for Google Account credentials, share the report as a Public Link as described in Google Looker Studio Help.
Additional Resources
- IQM Reports Connector In Looker Studio - Add the connector directly in Looker Studio
- Google Looker Studio Documentation - Official Google documentation
- Google's Chart Documentation - Chart types and options
- Data Credentials Options - Configure report credentials
- Public Sharing Options - Share reports publicly
- IQM Partnerships - View all IQM partners