Microsoft Power BI Integration
Microsoft Power BI is a data visualization and business intelligence software available for Windows. Power BI can be used to import data, create data models, and build visual reports using data from a variety of web and database connectors. The IQM Reports custom connector for Power BI Desktop allows users to easily access their IQM ad-serving data for Campaigns through the Power BI Desktop application, where it can be transformed into visual reports for sharing and analysis.
Prerequisites
Before using the IQM Reports Power BI connector, you must have:
- An active IQM account
- Microsoft Power BI Desktop installed
If you are unfamiliar with Power BI, detailed documentation can be found at Microsoft Power BI Documentation.
Setup
Step 1: Download the Connector
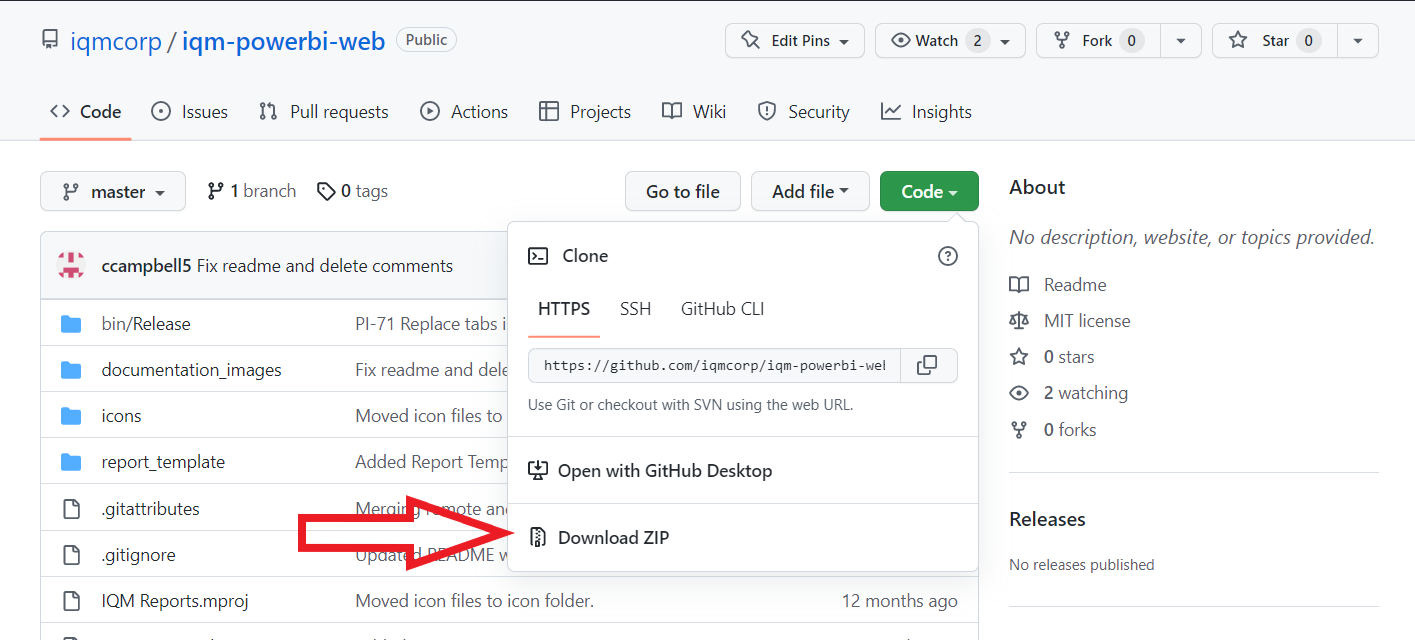
- Download the connector's GitHub repository from IQM Power BI Connector GitHub
- On the repository page, select Code > Download ZIP
Step 2: Install the Connector
- Open or extract the downloaded .zip file
- Locate the
iqm-powerbi-web.mezfile in thebin\AnyCPU\Debugdirectory - Place this
.mezfile into:C:\Users\<User_Name>\Documents\Power BI Desktop\Custom Connectors - If this directory does not exist, create it
Step 3: Enable Custom Connectors
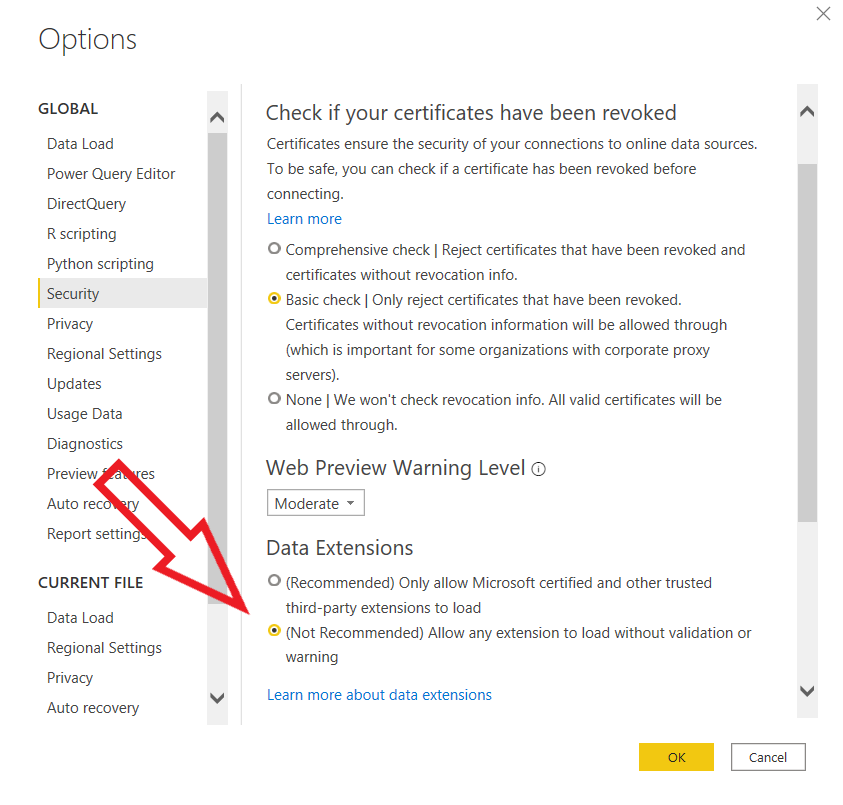
- Open Power BI Desktop
- Navigate to File > Options and settings > Options
- In the Security tab, under Data Extensions, check the option: (Not Recommended) Allow any extension to load without validation or warning
- Click OK and restart Power BI Desktop
The IQM Reports connector should now be available for use in the application.
Connect to IQM Reports Data
Step 1: Open Get Data Dialog
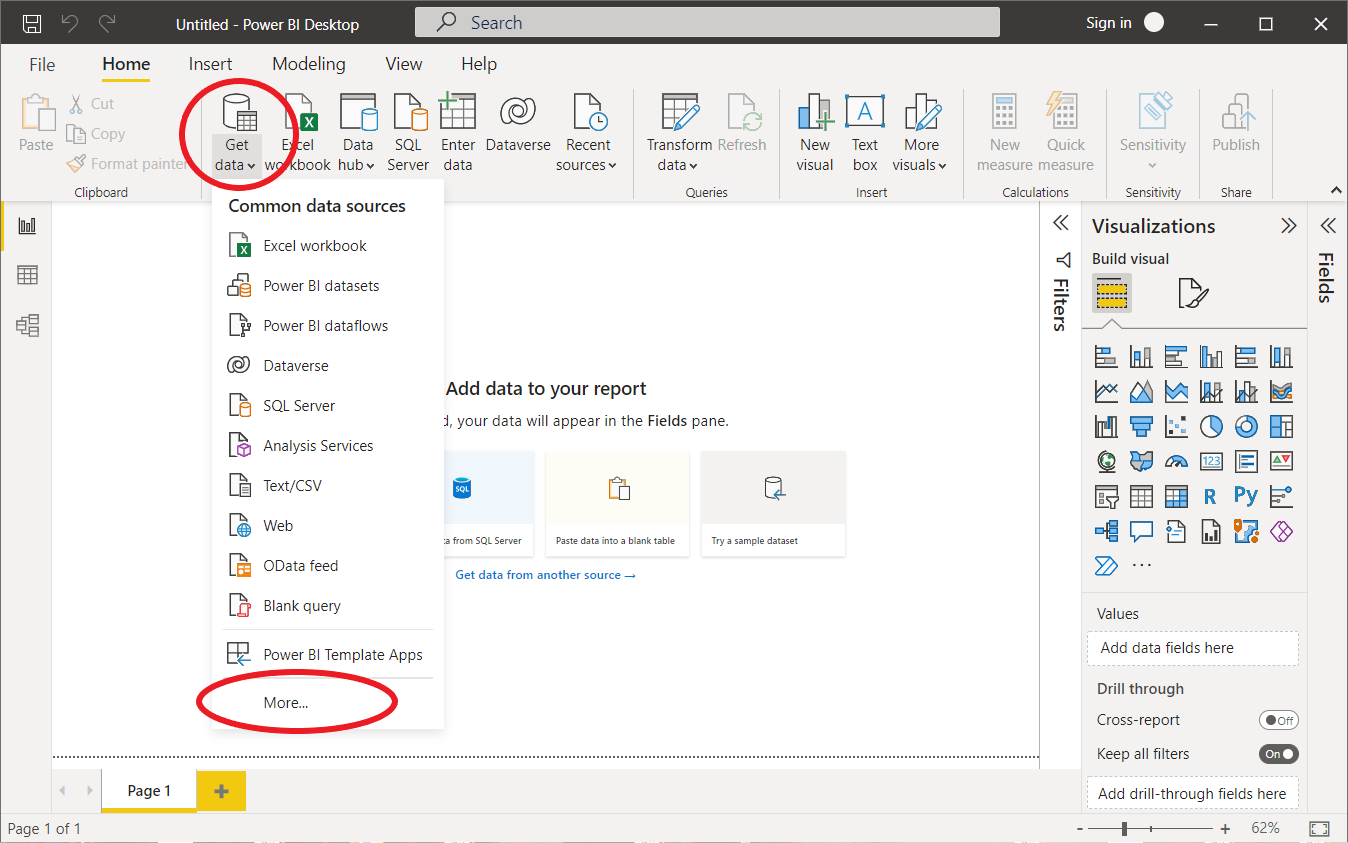
- In the Home tab at the top, click Get Data > More
- This opens the Get Data dialog with a list of data connectors
Step 2: Select IQM Reports Connector
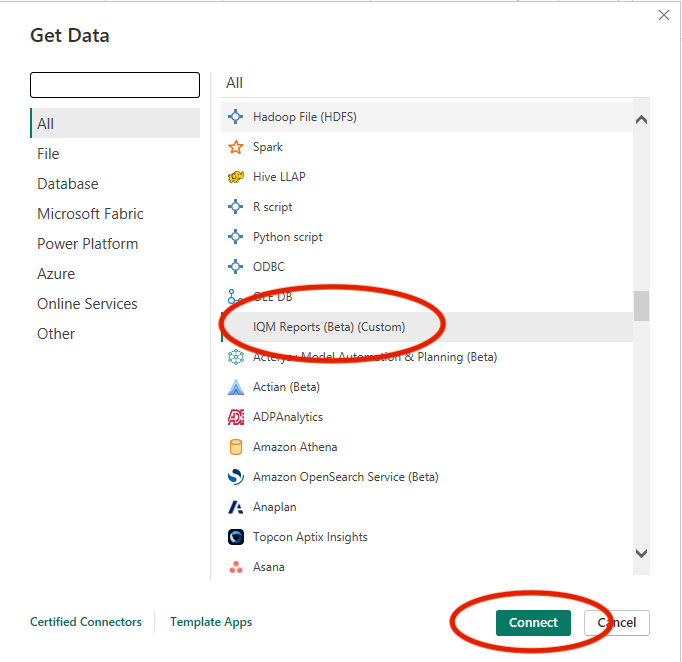
- Click on the connector labeled IQM Reports (Beta) (Custom)
- Click the Connect button at the bottom of the dialog
Step 3: Configure Parameters
Input the required parameters:
- Date Interval Start: Start date in format
YYYY-MM-DD(e.g., 2025-01-15) - Date Interval End: End date in format
YYYY-MM-DD - Group By: Available dimensions include Campaigns and Creatives
Dates are interpreted as UTC. The start date begins at midnight (00:00:00), and the end date ends at 11:59:59 PM (23:59:59).
Step 4: Sign In and Authorize
- Click Sign in to authorize the connector
- Enter your IQM email and password
- Approve OAuth access to allow Power BI to access your IQM data
- After signing in, click Connect
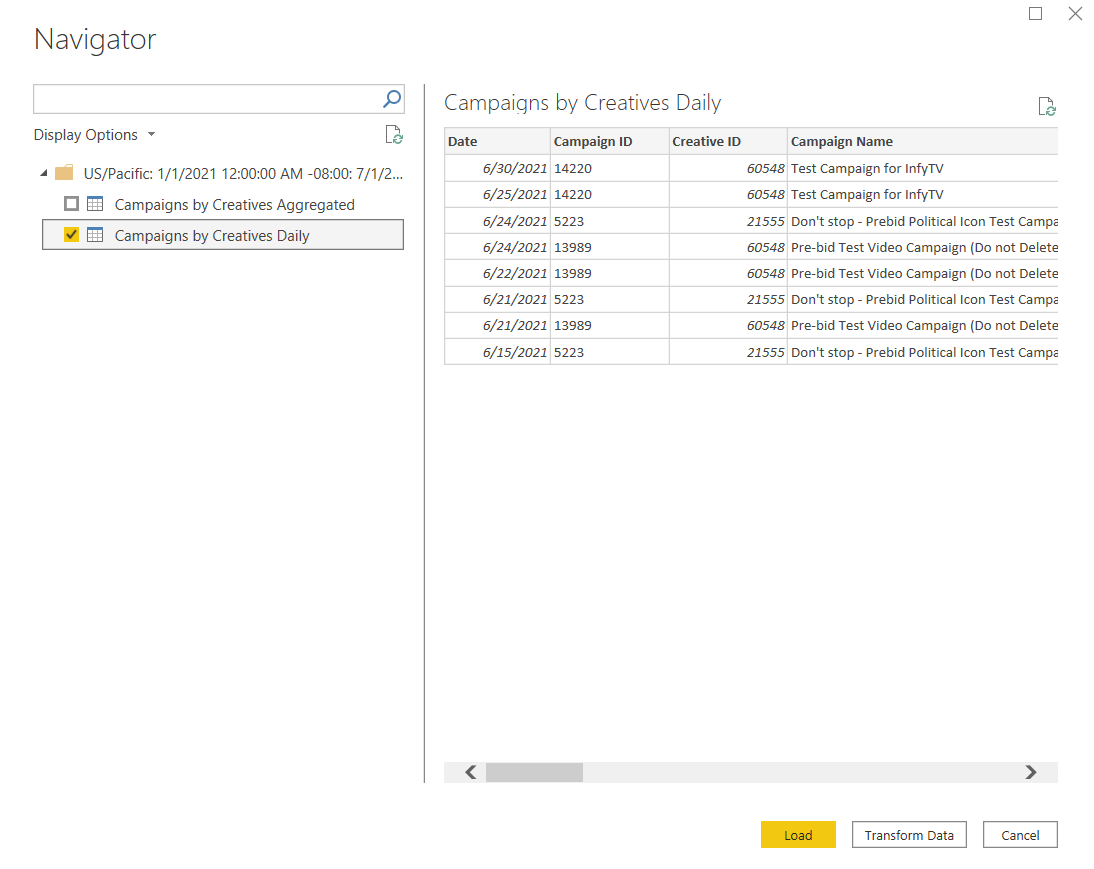
Step 5: Select Data Tables
- In the Navigator window, select the data tables to import by checking the checkboxes
- Each Group By dimension provides:
- A table of aggregated ad-serving data
- A table of daily ad-serving data
- Click Load
Working with Data
Data View
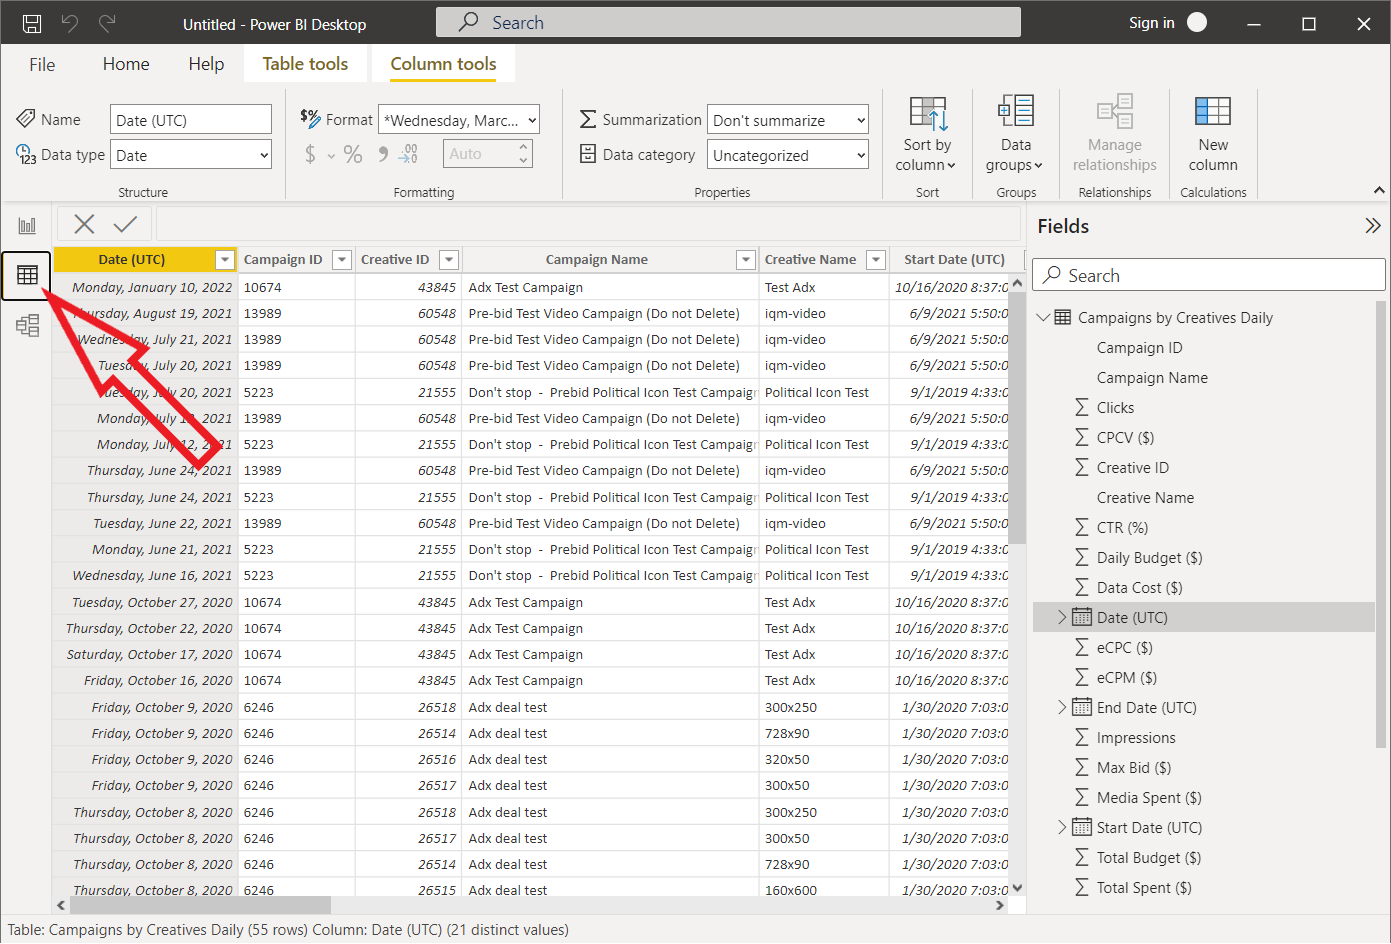
Power BI Desktop retrieves ad-serving reporting data and converts them into tables. In the Data view, you can:
- View and manipulate each table
- Filter and sort data
- Add calculated columns and measures
For more information, see Power BI Data View Documentation.
Report View
To create a visual report:
- Navigate to the Report view
- Click on a visualization option in the Visualizations sidebar
- Drag fields from the Fields sidebar to the visualization components
Power BI offers many built-in visualization types. See Power BI Visualization Types for a complete list.
Additional visualization types can be downloaded from Microsoft AppSource via More visuals > From AppSource in the Home tab.
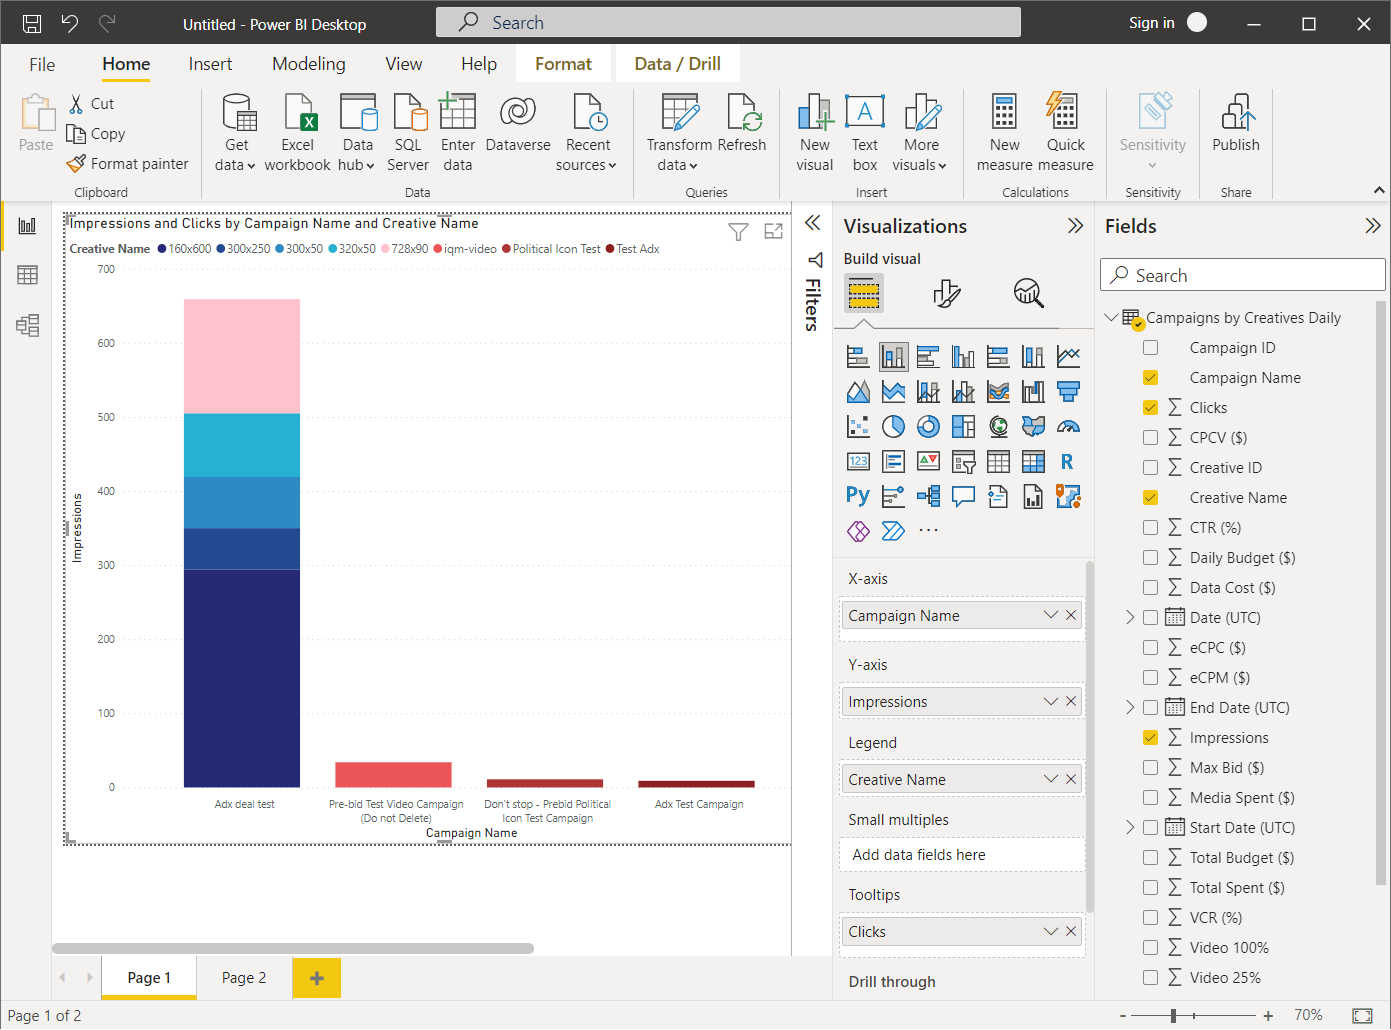
Example Visualization
To create a Stacked Column Chart:
- Select Stacked Column Chart from the Visualizations sidebar
- Drag Campaign Name to X Axis
- Drag Impressions to Y Axis
- Drag Creative Name to Legend
- Drag Clicks to Tooltips
For detailed information on creating visualizations, see Power BI Visualizations Documentation.
Using the Report Template
The IQM Reports GitHub repository includes a report template file (IQM_Report_Template.pbit) in the report_template directory. This file is an editable template for a visual report that uses the IQM Reports connector, showing an example of how the connector might be used.
Using the Template
- Extract the repository .zip file if not already extracted
- Open Power BI Desktop and select File > Import > Power BI template
- Navigate to the extracted directory and select
IQM_Report_Template.pbit
Upon opening the template, Power BI will attempt to use the IQM Reports connector to import data from IQM. If you are not already logged in, Power BI will prompt you for your login credentials. Click Sign in as different user and enter your IQM account credentials to use the report template.
After you log in, navigate to the Report tab to view the report template. The report template consists of several visualizations that are now pre-filled with your IQM ad-serving data according to the predefined connector inputs present in the template file.
Customizing Date Range
You will likely want to customize the date range (Date Interval Start and Date Interval End) for the report data. To modify the connector input values:
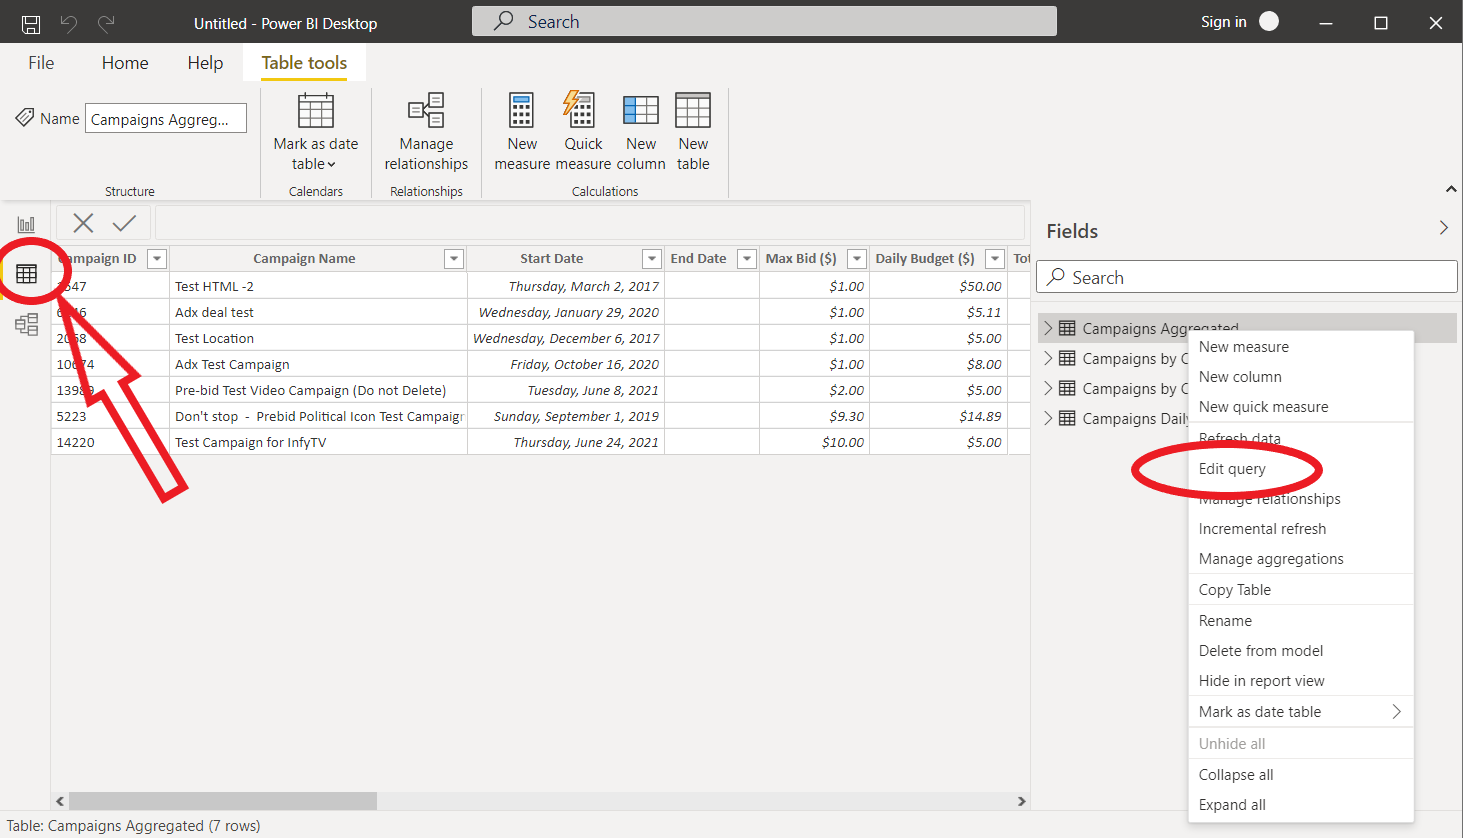
- Click on the Data tab
- Right-click on the table whose date range you want to adjust
- Select Edit query to open the Power Query Editor
Editing Queries
The Power Query Editor window allows you to connect to data sources and transform imported data sets. It provides many powerful tools for transforming data, including filtering rows, calculating new columns, joining queries, and more. For more information, see Power Query Documentation.
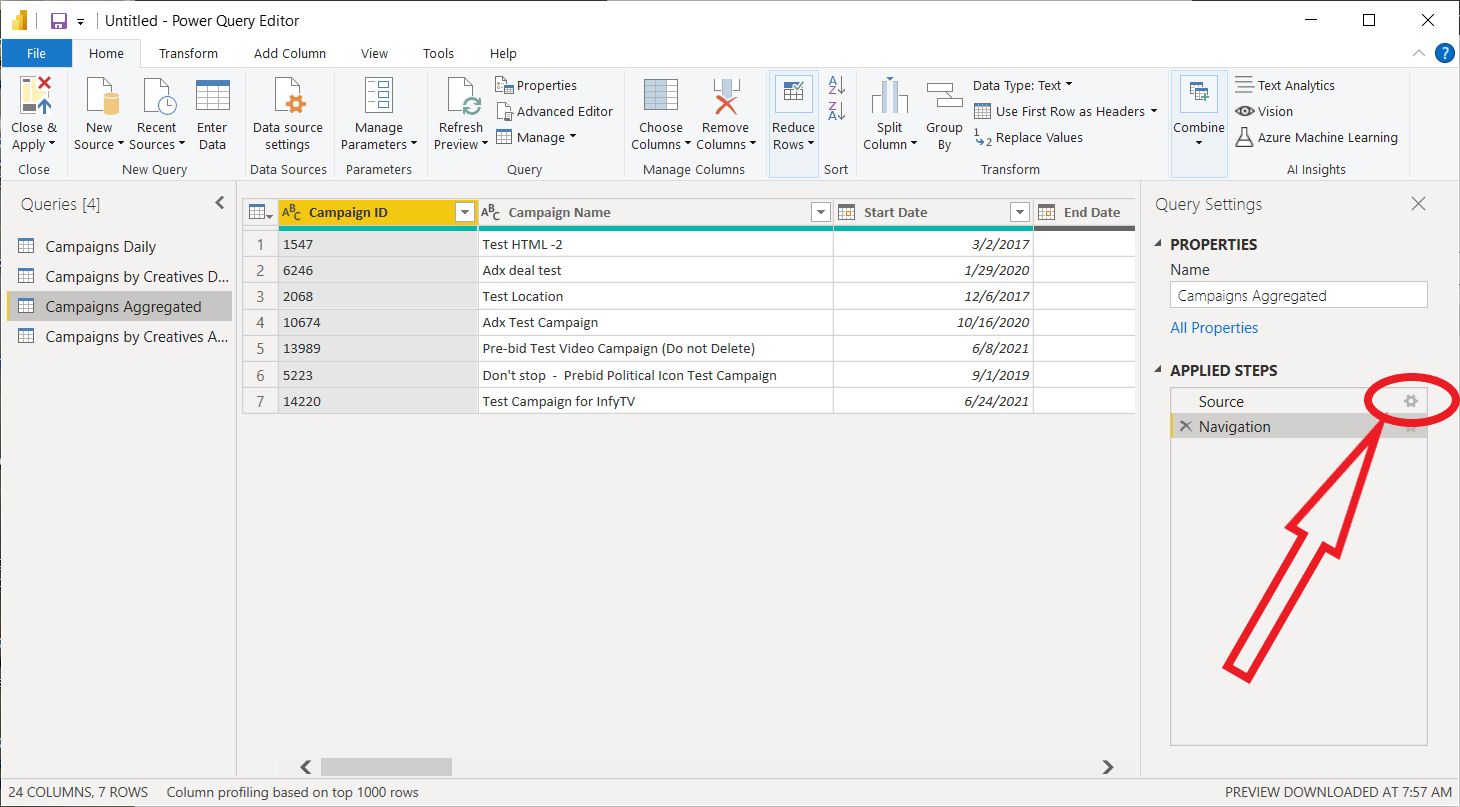
Applied Steps
In the Power Query Editor, locate the Applied Steps section in the sidebar. This section lists all the steps and transformations applied to the data set imported from the query selected under Queries (on the left). Two steps are initially applied:
- Source: Represents the connector and the parameters passed to it
- Navigation: Represents the tables selected to be imported from the connector
To edit connector parameters:
- Under Applied Steps, click the gear icon next to Source
- A popup window will allow you to edit the parameters
- Modify the Date Interval Start and Date Interval End parameters
- Click OK
If you are using the report template or have visualizations using the data set from the query, avoid changing the Group By and Second Group By fields—this may break the visualizations that use the queries.
Repeat this process for each query in the Queries sidebar whose parameters you want to modify.
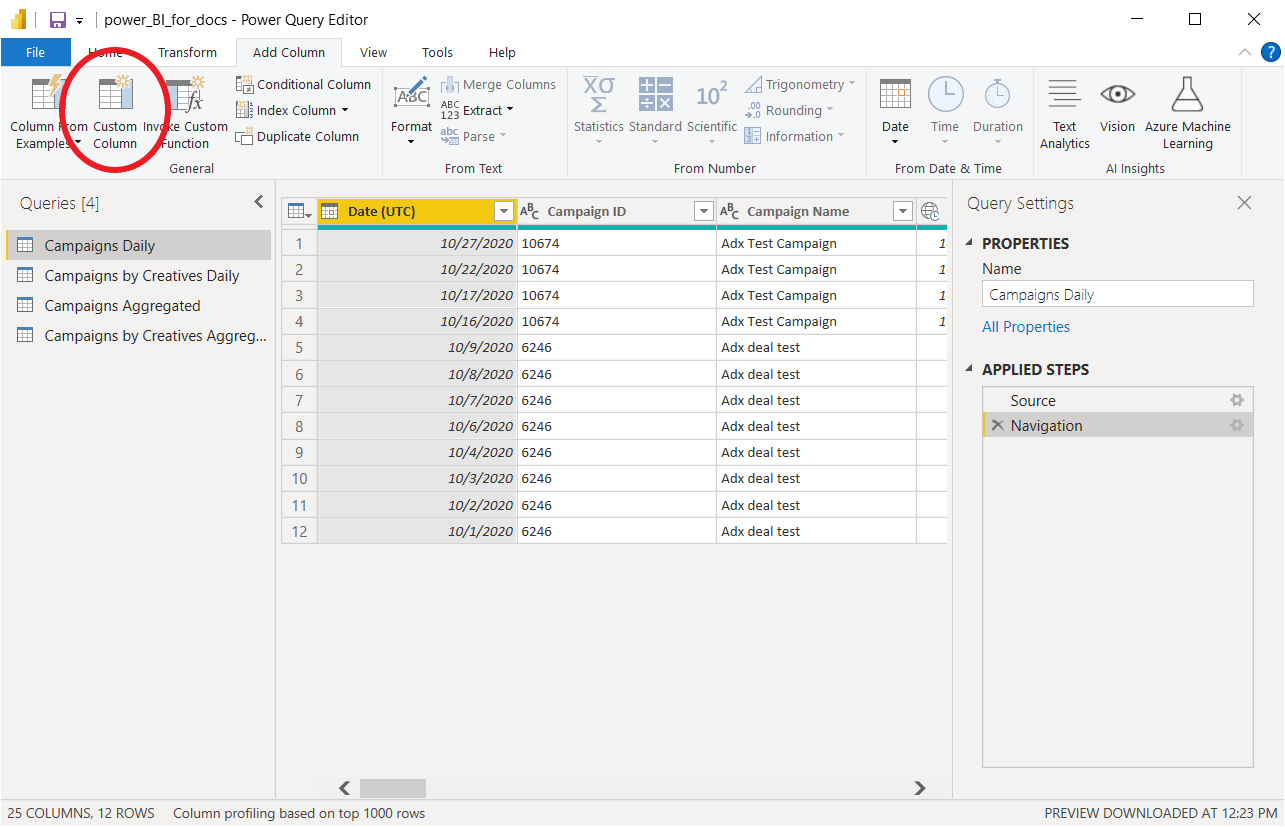
Custom Columns
The Power Query Editor provides tools for transforming query data. For example, you can add new columns to the tables generated by the queries.
Example: Adding a column that shows the percentage of daily budget spent each day:
- Create or select a query that imports daily ad-serving data grouped by campaigns
- In the Add Columns tab, select Custom Column
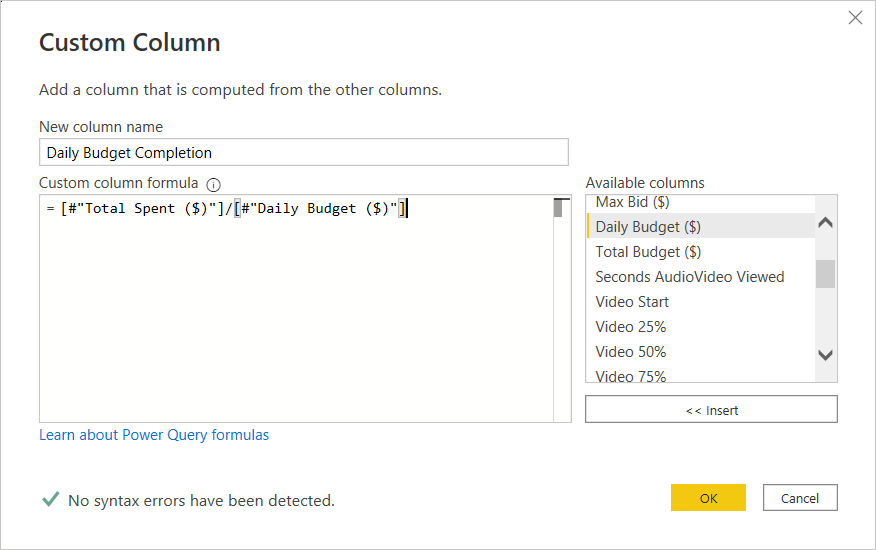
- In the Custom Column window, enter:
- The name of the new column
- The formula to calculate the column value (can be a simple expression or a Power Query M Formula)
- Select column names from the Available Columns list on the right
- Click OK to add the column to the table (a new step will be added to Applied Steps)
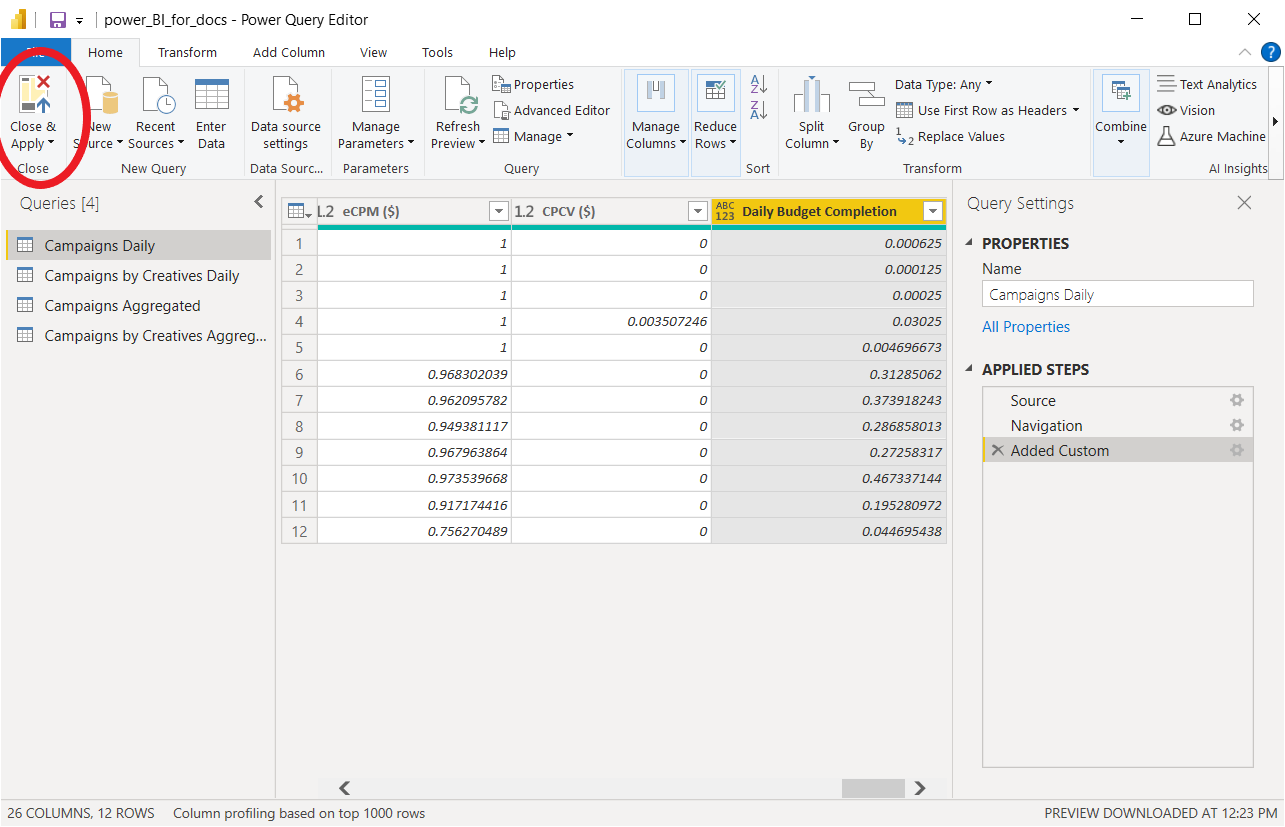
Finalizing Changes
To finalize changes to edited queries:
- Click Close & Apply in the Home tab
- This saves changes to the queries and reloads ad-serving data from the connector
- Navigate back to the Report tab to view and edit the updated report
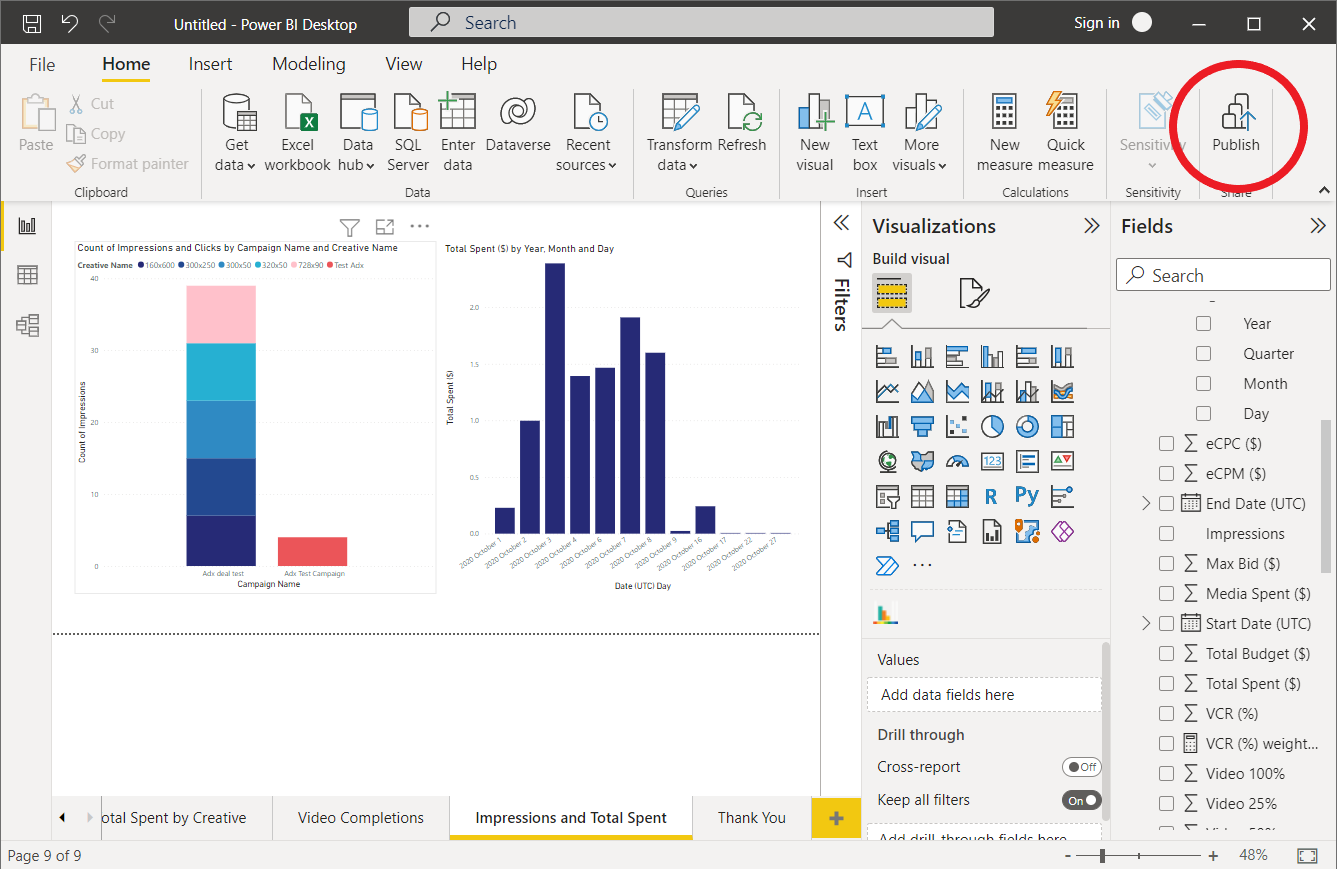
Publishing Reports
For users with a Power BI Pro or Premium Per User (PPU) license, reports can be shared via the Power BI Service.
To Publish a Report
- Save the report in Power BI Desktop (File > Save As)
- Select Publish in the Home tab of the Report view
- Sign in to Power BI Service if prompted
- Select the workspace to publish to
- Click Open in Power BI to view the report in the Power BI Service
Additional Resources
- IQM Power BI Connector (GitHub) - Source code and documentation
- Power BI Desktop Download - Free download
- Power BI Documentation - Microsoft's official documentation
- Power BI Data View Documentation - Working with data
- Power BI Visualization Types - Available chart types
- Power BI Visualizations Documentation - Creating visualizations
- Power Query Documentation - Power Query Editor guide
- Power Query M Formula Reference - M formula language reference
- Power BI Service - Online Power BI portal
- IQM Partnerships - View all IQM partners