Tableau Integration
Tableau is a data visualization software used to create visual reports and dashboards from data sets imported from databases or the web. The IQM Reports web data connector (WDC) for Tableau allows users to import IQM Campaign ad-serving data into Tableau and create visual reports for data analysis.
Prerequisites
Before using the IQM Reports web data connector, you must have:
- An active IQM account
- Tableau Desktop or Tableau Public installed
- Tableau Public (free)
- Tableau Desktop
The IQM Reports data connector is compatible with Tableau Desktop version 2021.1.2 or later.
If you are unfamiliar with Tableau, detailed documentation can be found at Tableau Help.
Setup
Step 1: Open Tableau
Open Tableau Desktop or Tableau Public.
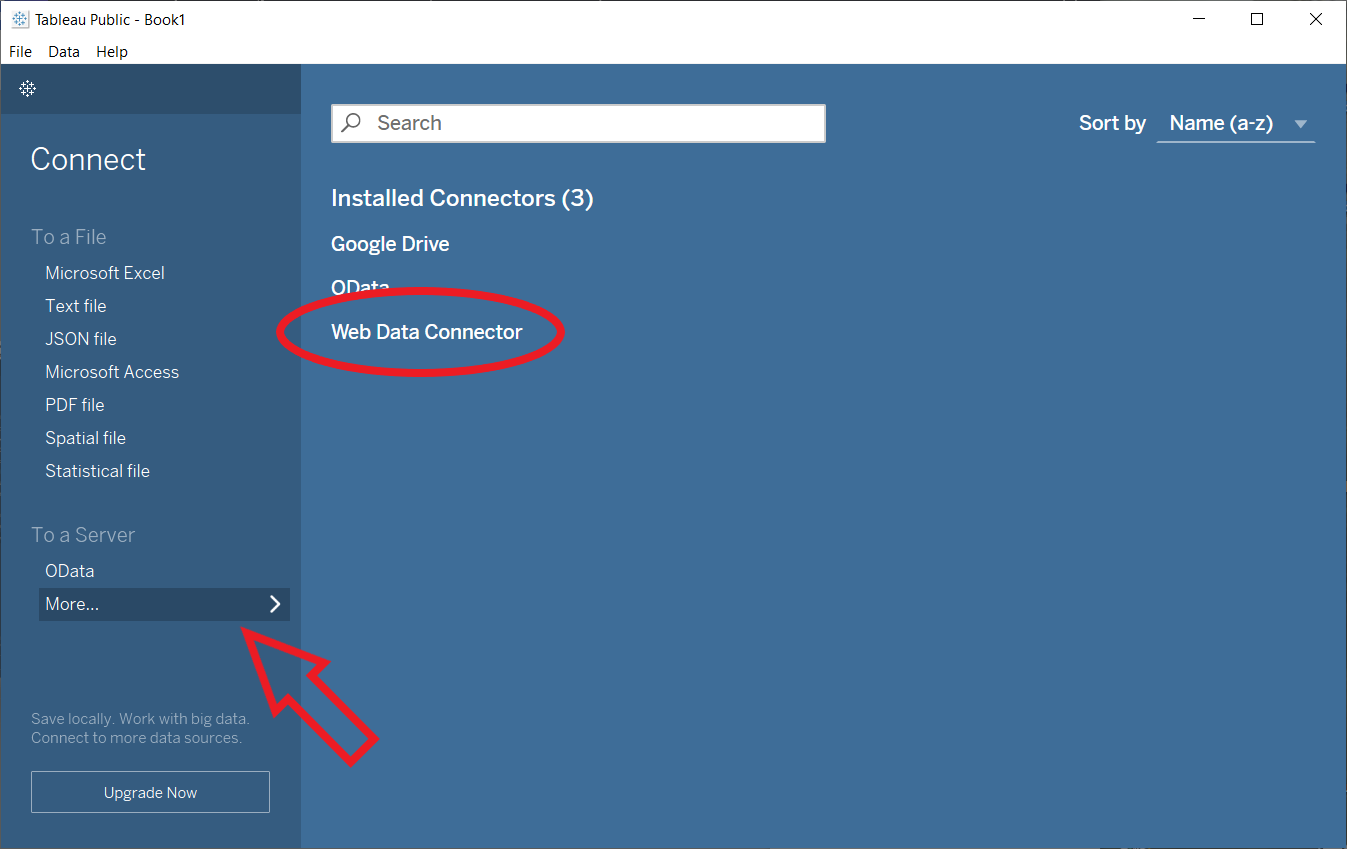
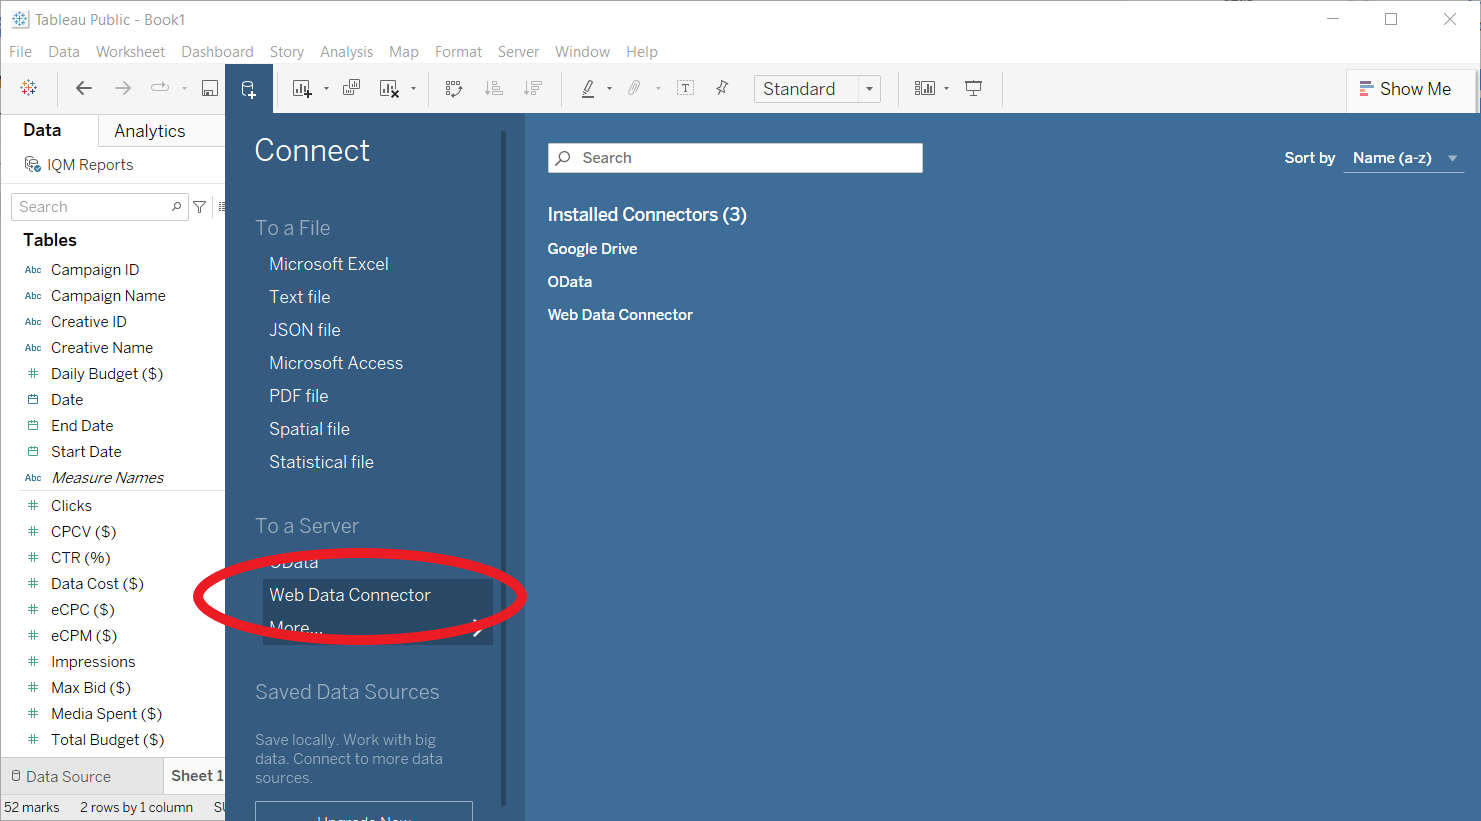
Step 2: Connect to Web Data Connector
- On the landing screen, select More under Connect > To a Server in the sidebar
- Select Web Data Connector
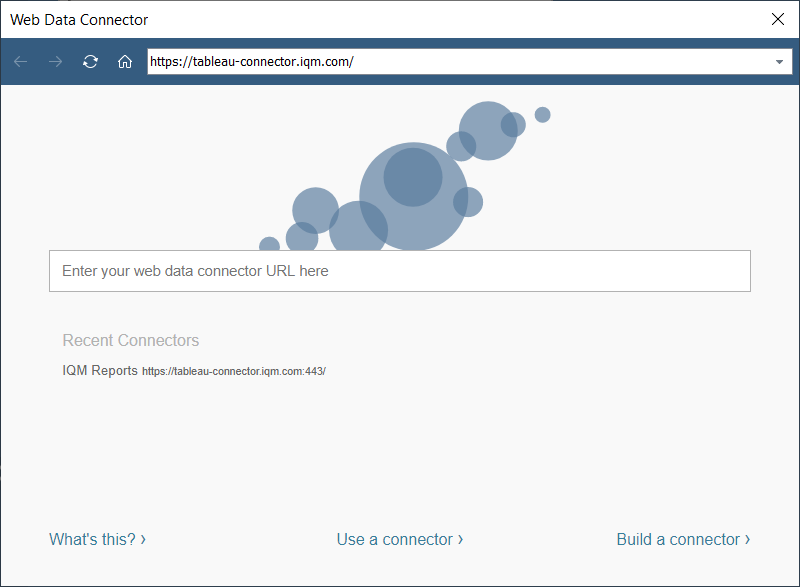
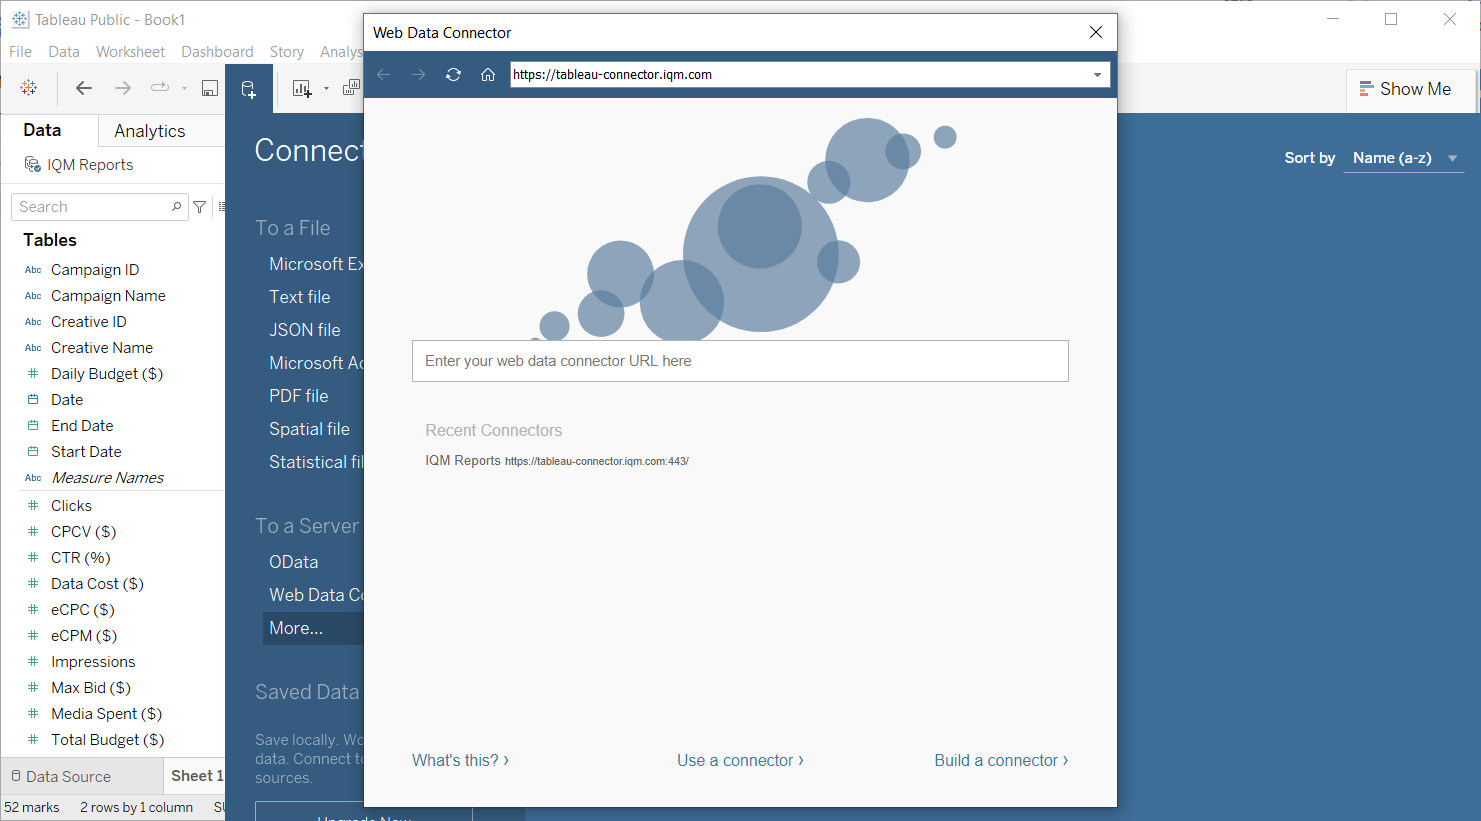
Step 3: Load the IQM Reports Connector
- Type
https://tableau-connector.iqm.com/into the address bar - Press Enter to load the IQM Reports web data connector
Step 4: Log In
Enter your IQM email and password and click the Log In button.
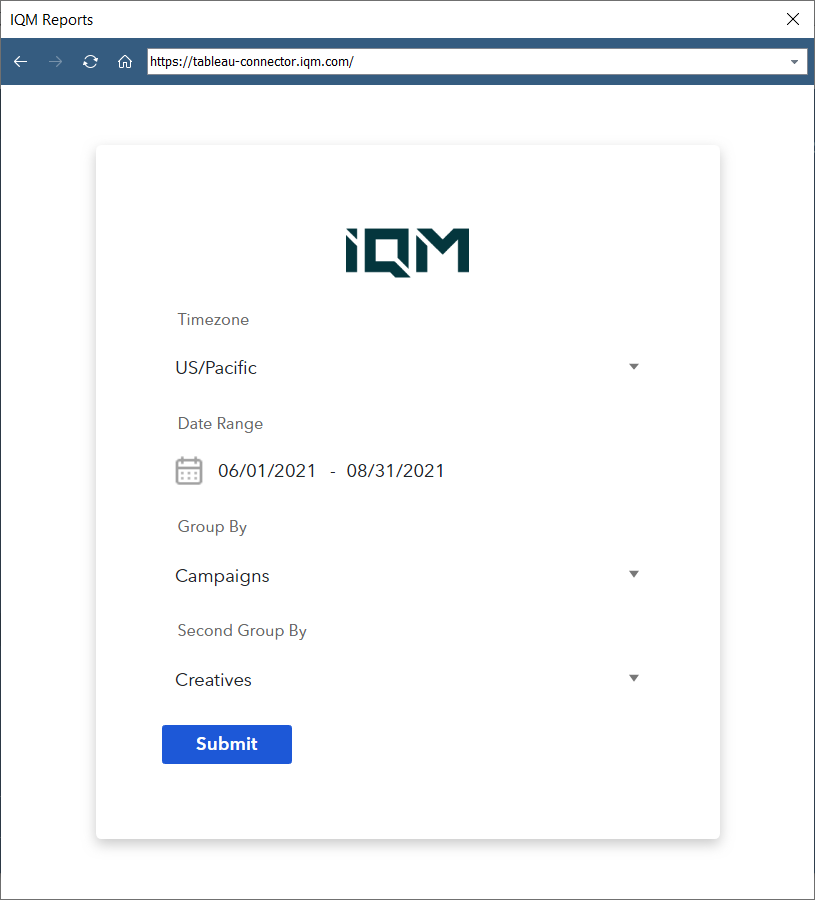
Step 5: Configure Report Parameters
Input the parameters for the report data:
- Timezone: The timezone for date interpretation
- Date Range: The reporting period (begins at midnight on the first day and ends at 11:59 PM on the last day)
- Group By: Primary dimension (Campaigns or Creatives)
- Second Group By: Secondary dimension (optional)
The IQM Reports WDC returns ad-serving data only for currently-running Campaigns, and returns tables for both aggregated and daily data.
After filling out the inputs, click Submit to continue.
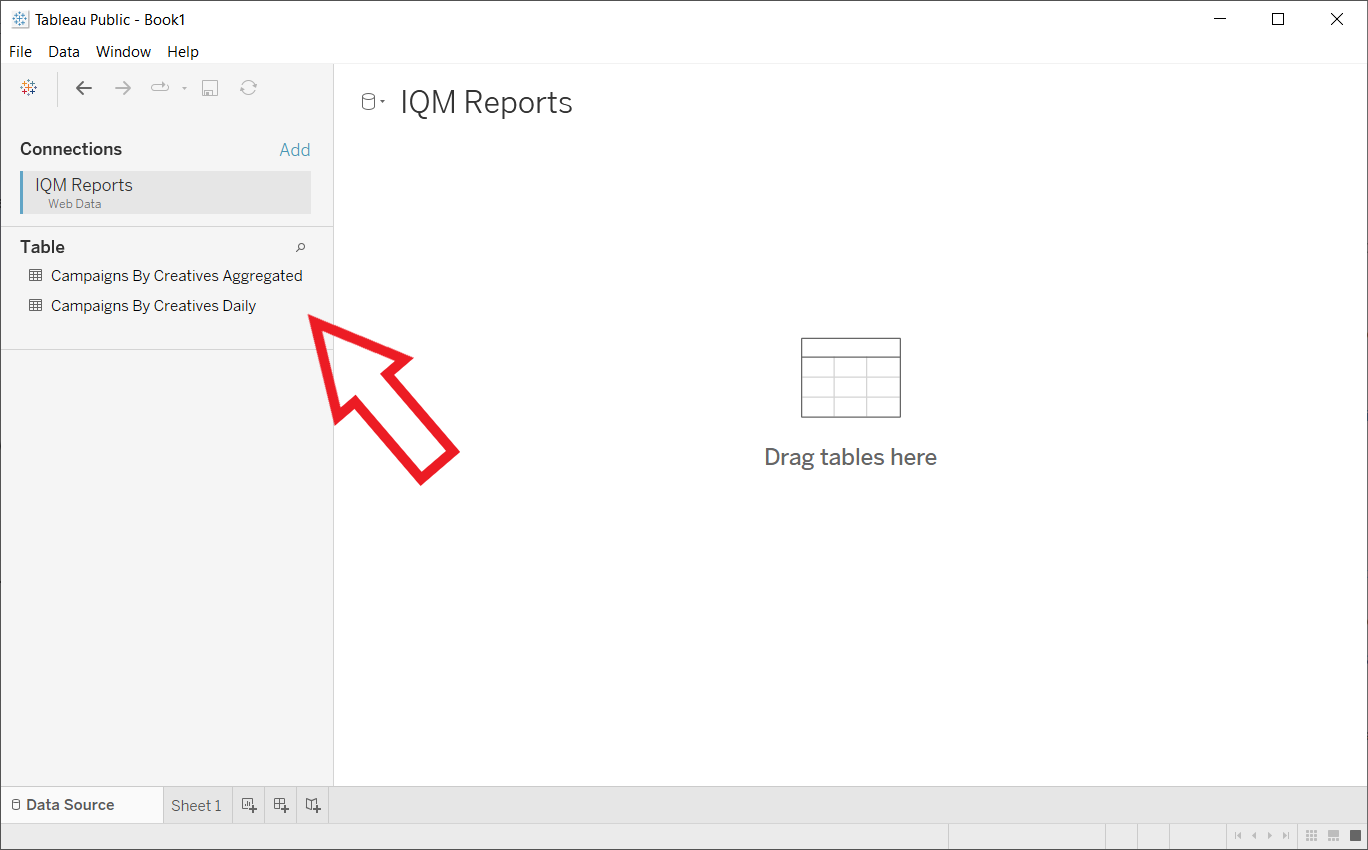
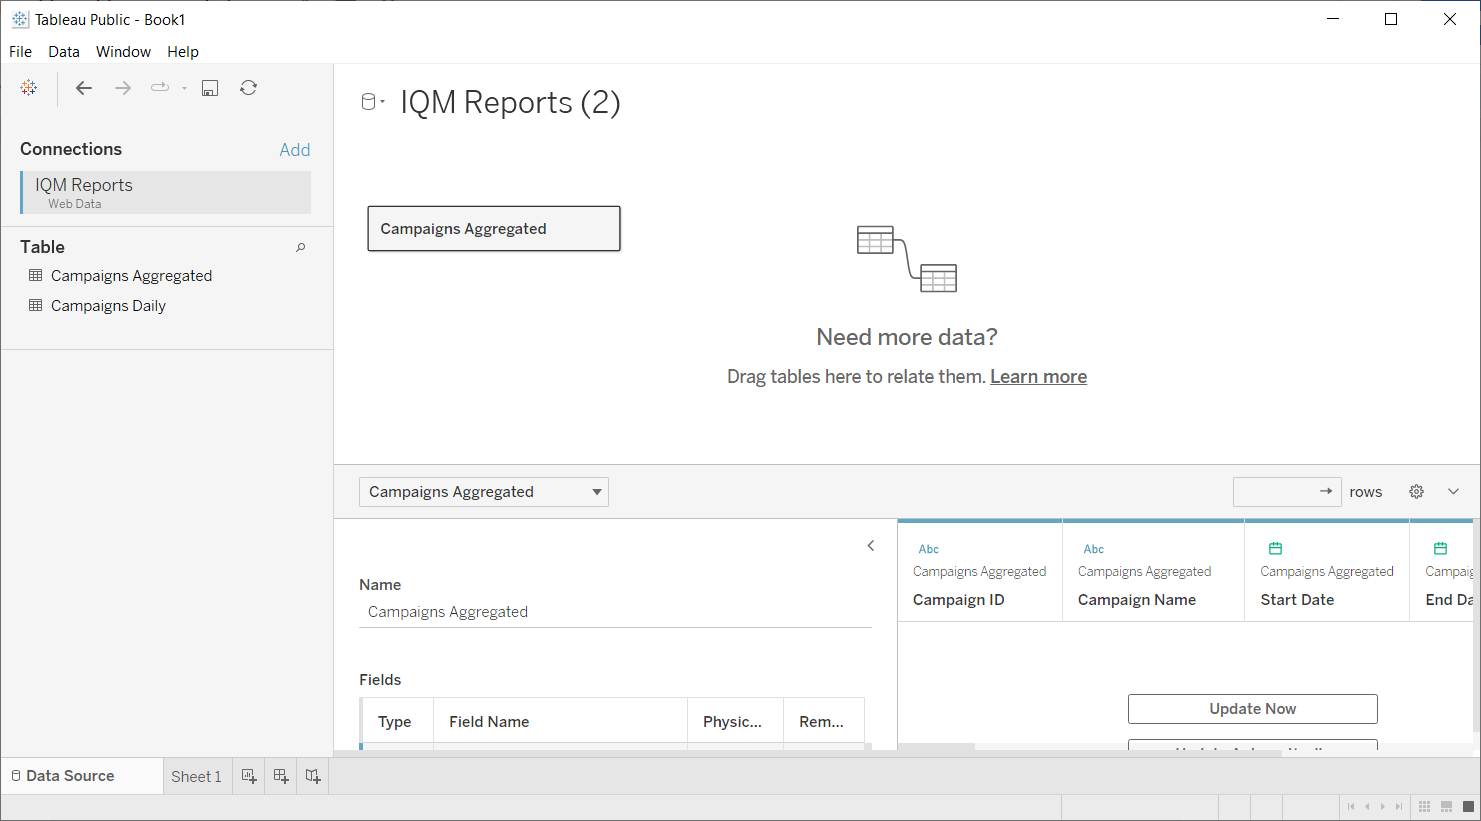
Step 6: Configure Data Source
- Tableau takes you to a Data Source page
- Click and drag the desired table from the Table section in the sidebar
- The IQM Reports WDC provides both daily and aggregated ad-serving data
For detailed information about Tableau data sources, see the Official Tableau Documentation.
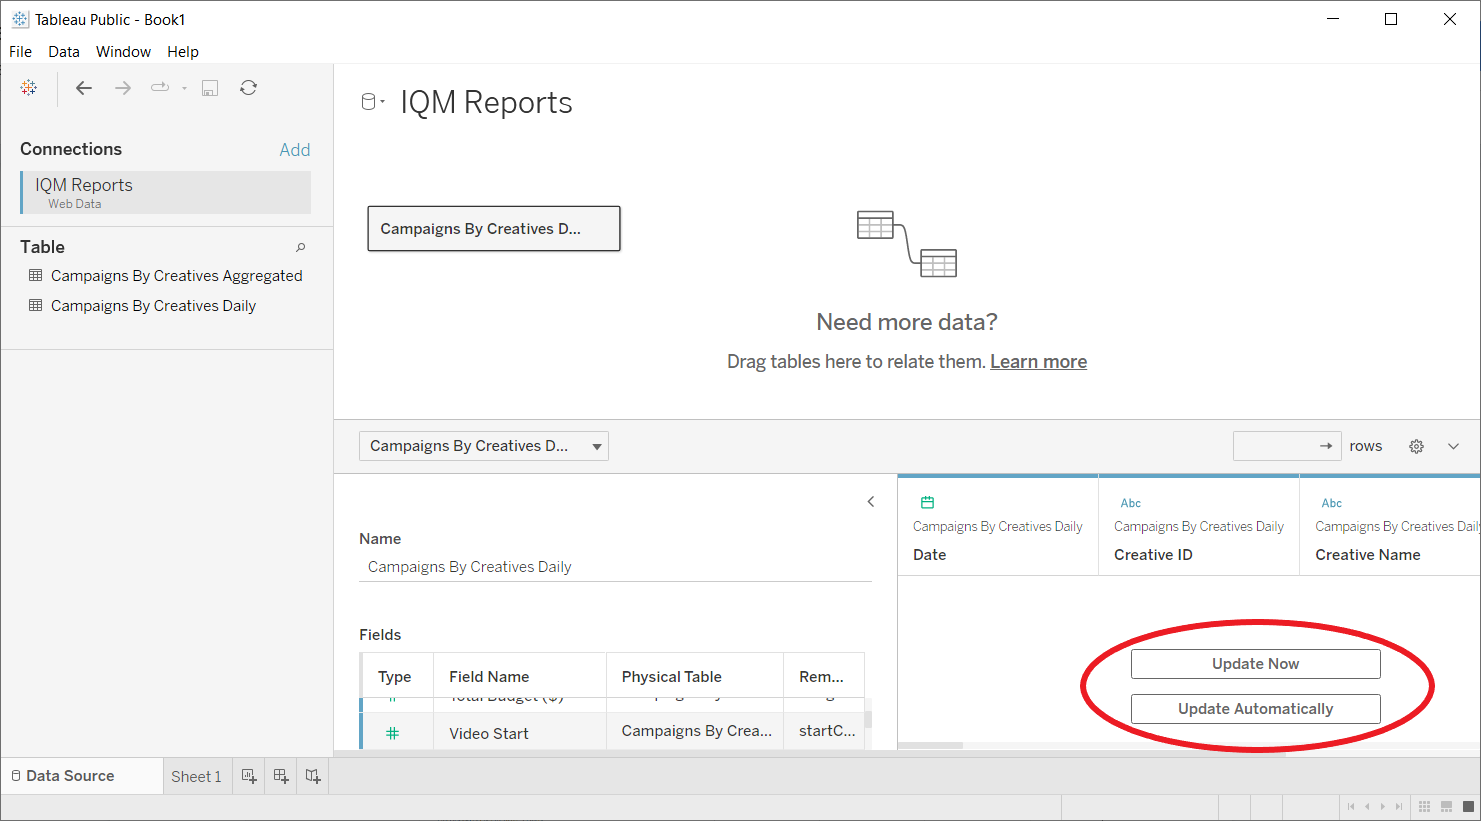
Step 7: Preview Data
Click Update Now or Update Automatically in the bottom-right panel to preview the data.
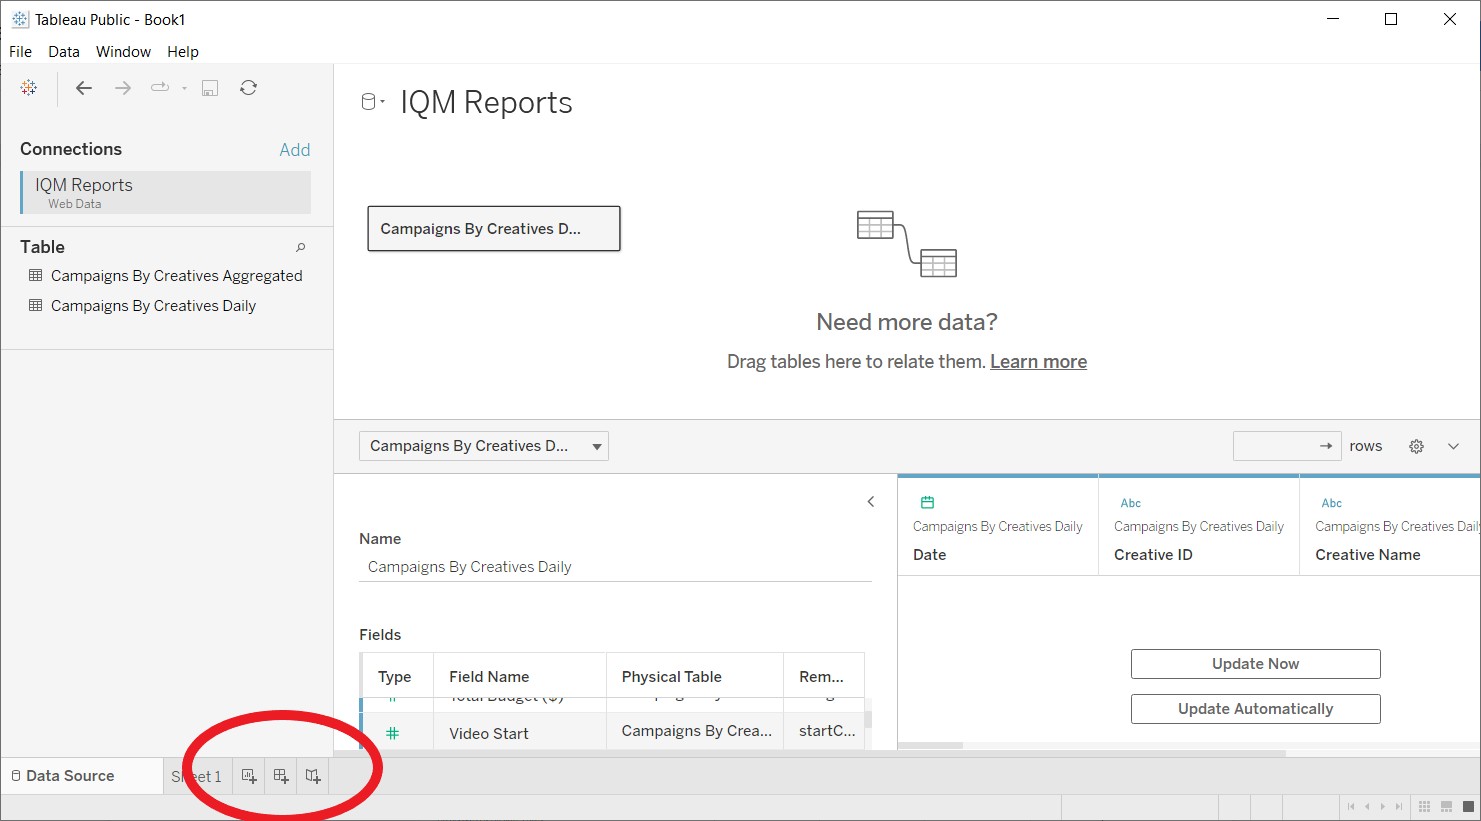
Creating Visualizations
Worksheets, Dashboards, and Stories
- Worksheet: A single chart or visualization
- Dashboard: A collection of worksheets
- Story: A sequence of worksheets and dashboards
To create a new worksheet, dashboard, or story, click on the icons in the bottom left of the window.
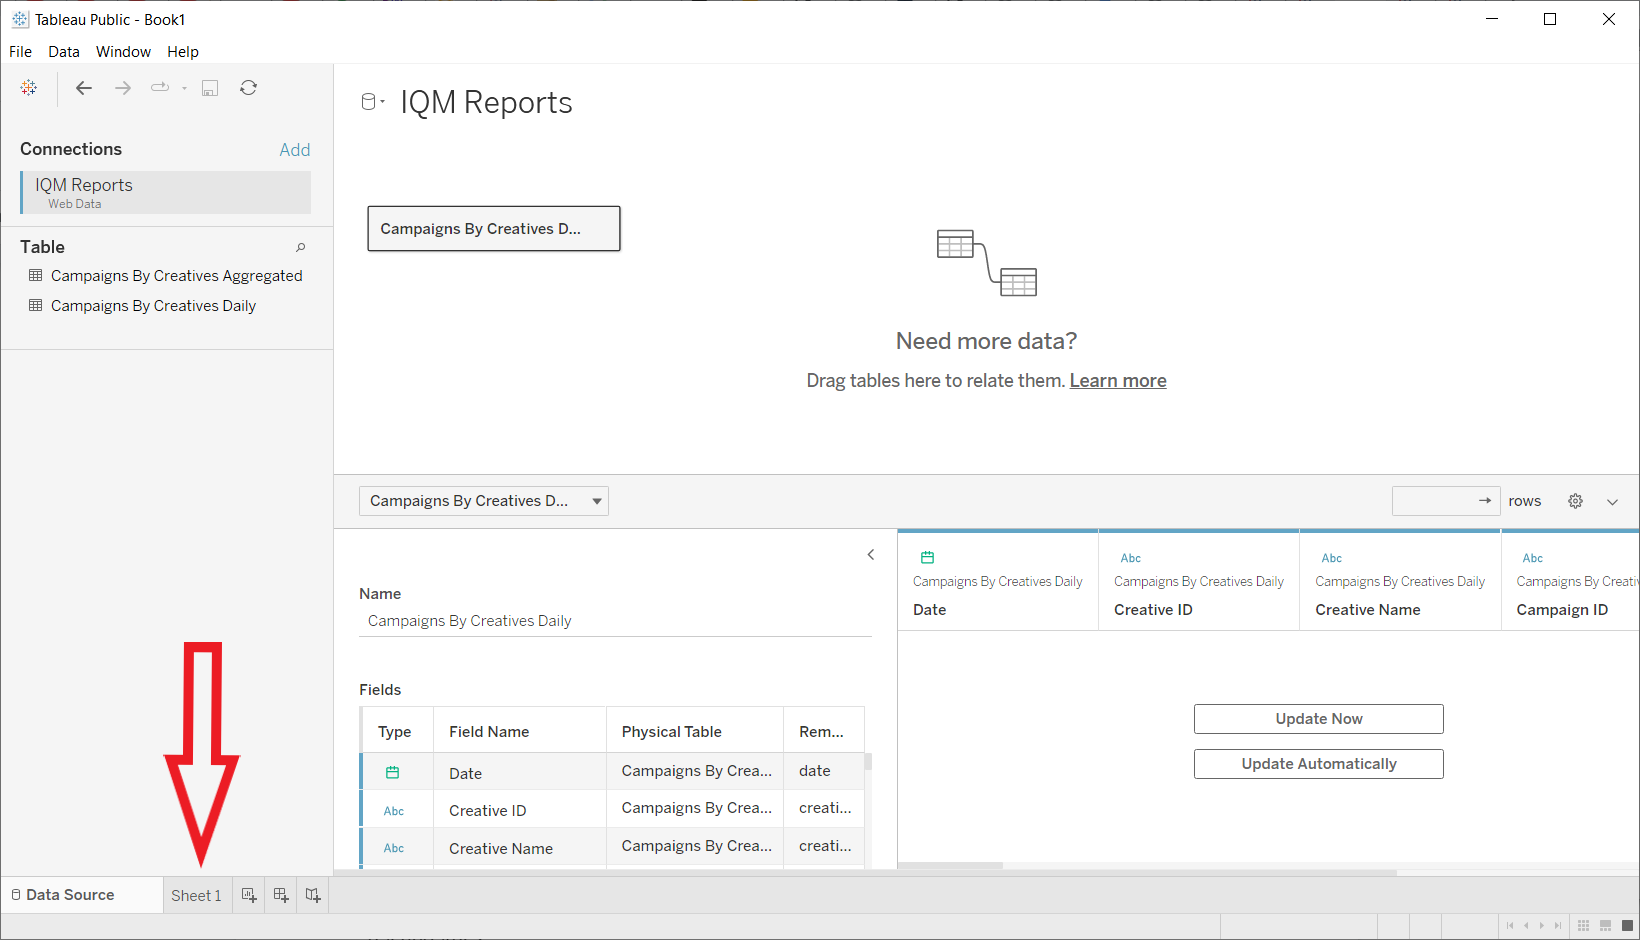
Building a Visualization
- Click on Sheet 1 in the bottom left corner to open the Tableau Workspace
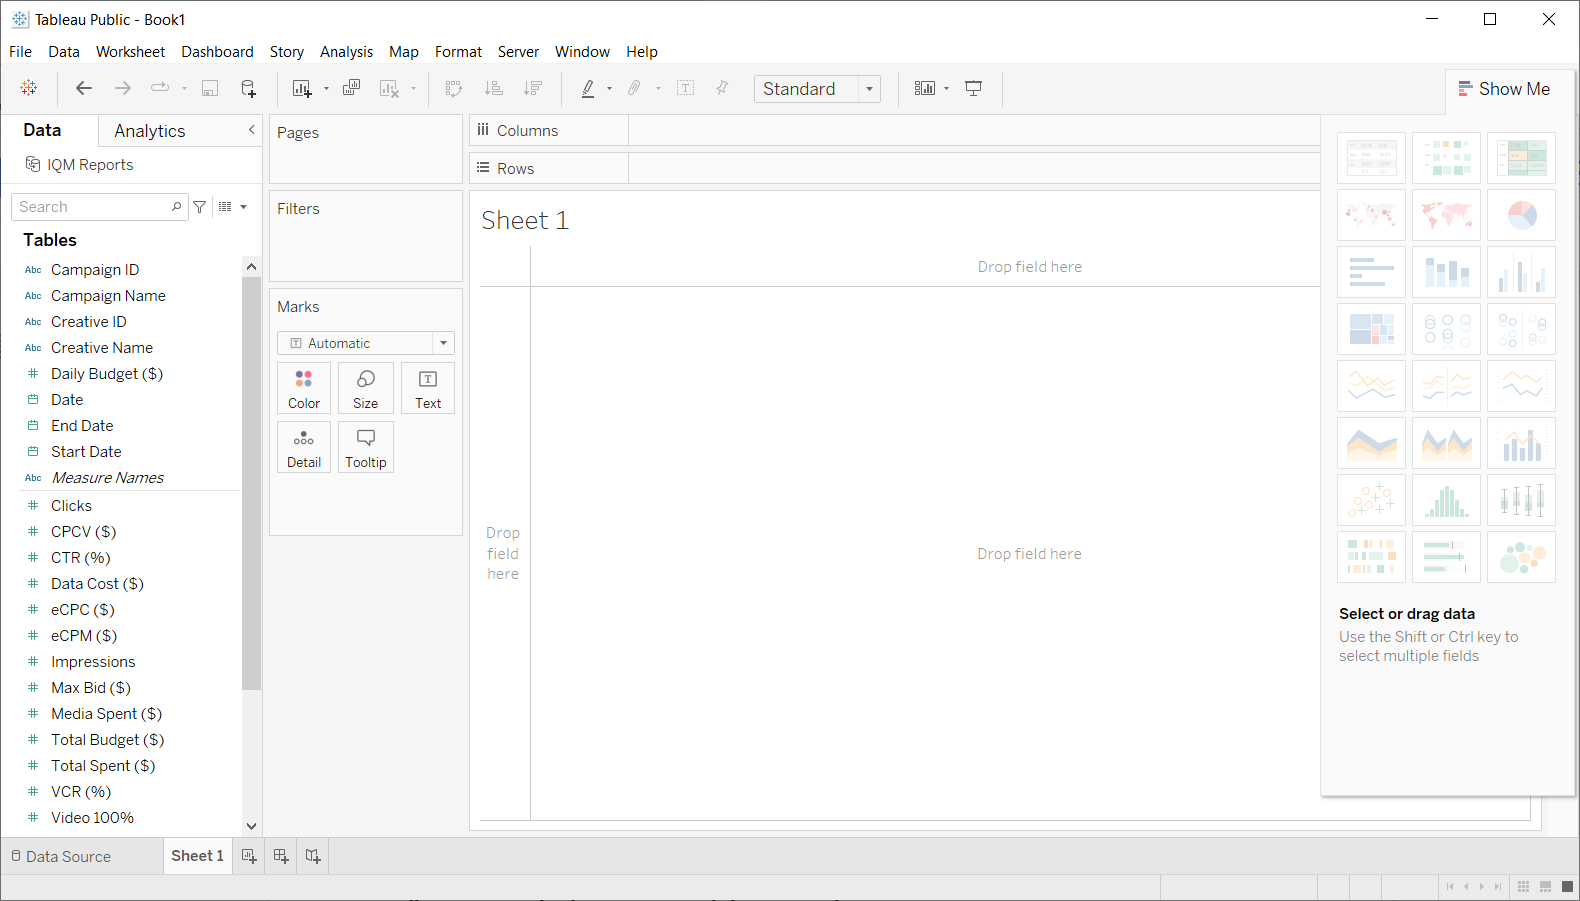
- Values from the IQM Reports WDC are listed in the left sidebar
- Drag fields from the sidebar to:
- The areas that say "Drop field here"
- The Columns and Rows shelves at the top
Understanding Data Types
In the Tableau Workspace, the values imported from the IQM Reports WDC are listed in the left sidebar. When processing data fields, Tableau distinguishes between:
- Dimensions: Qualitative values such as names and dates
- Measures: Quantitative numeric values
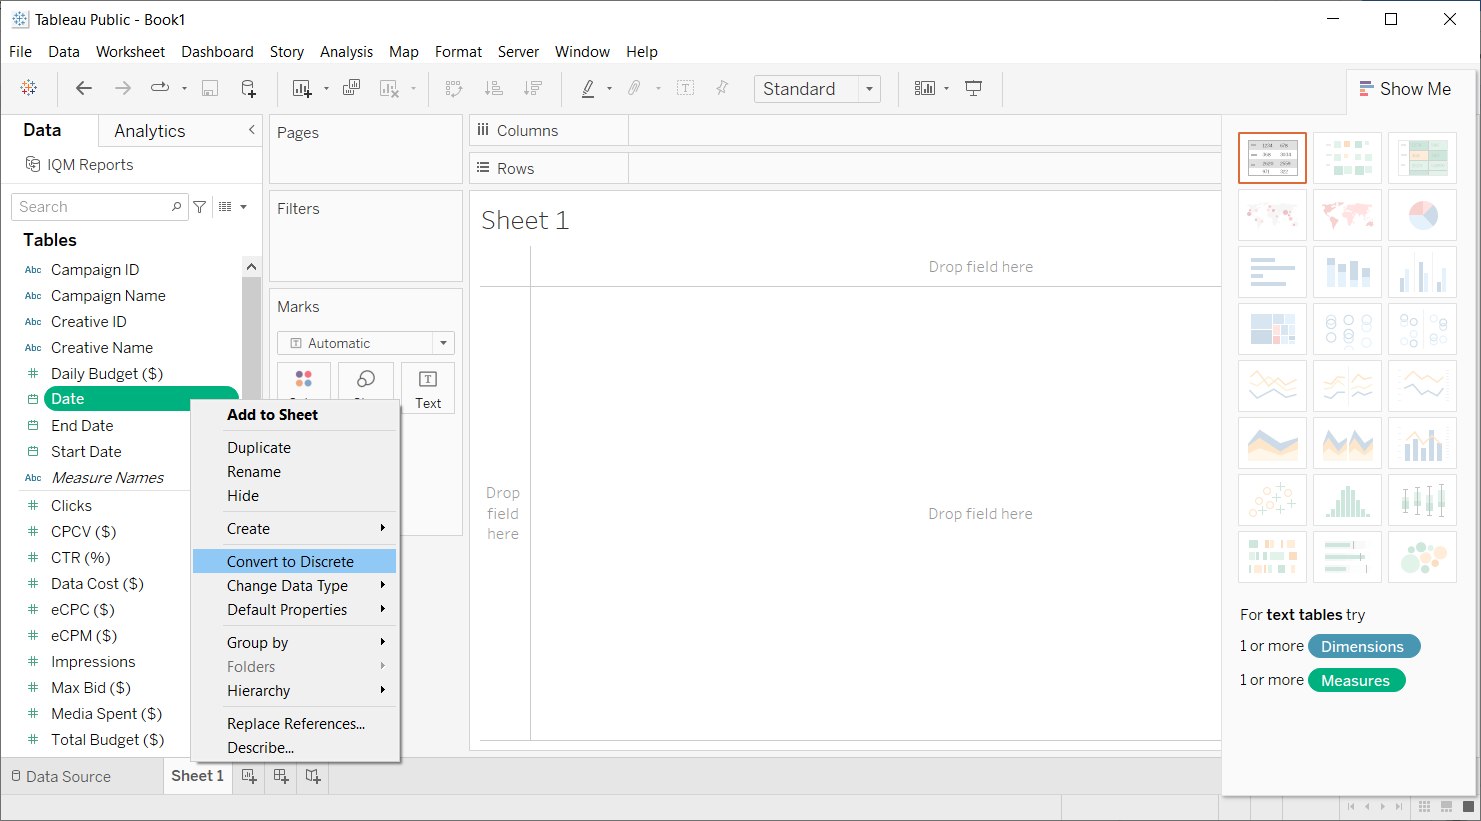
Tableau also processes discrete and continuous values differently:
- Continuous (green fields): Adds axes to a visualization
- Discrete (blue fields): Adds headers to the view
Tableau automatically attempts to infer whether each field is discrete or continuous. To manually change a field's type, right-click on the field in the Data sidebar and select Convert to Discrete or Convert to Continuous.
For more information about how Tableau uses these types of data, see Tableau Data Fields Types and Roles.
Example Visualization
To create a data visualization:
- Click and drag the desired fields from the left sidebar to the areas that say "Drop field here", or to the Columns and Rows shelves at the top of the preview
- When dragging and dropping fields, Tableau will automatically create a chart
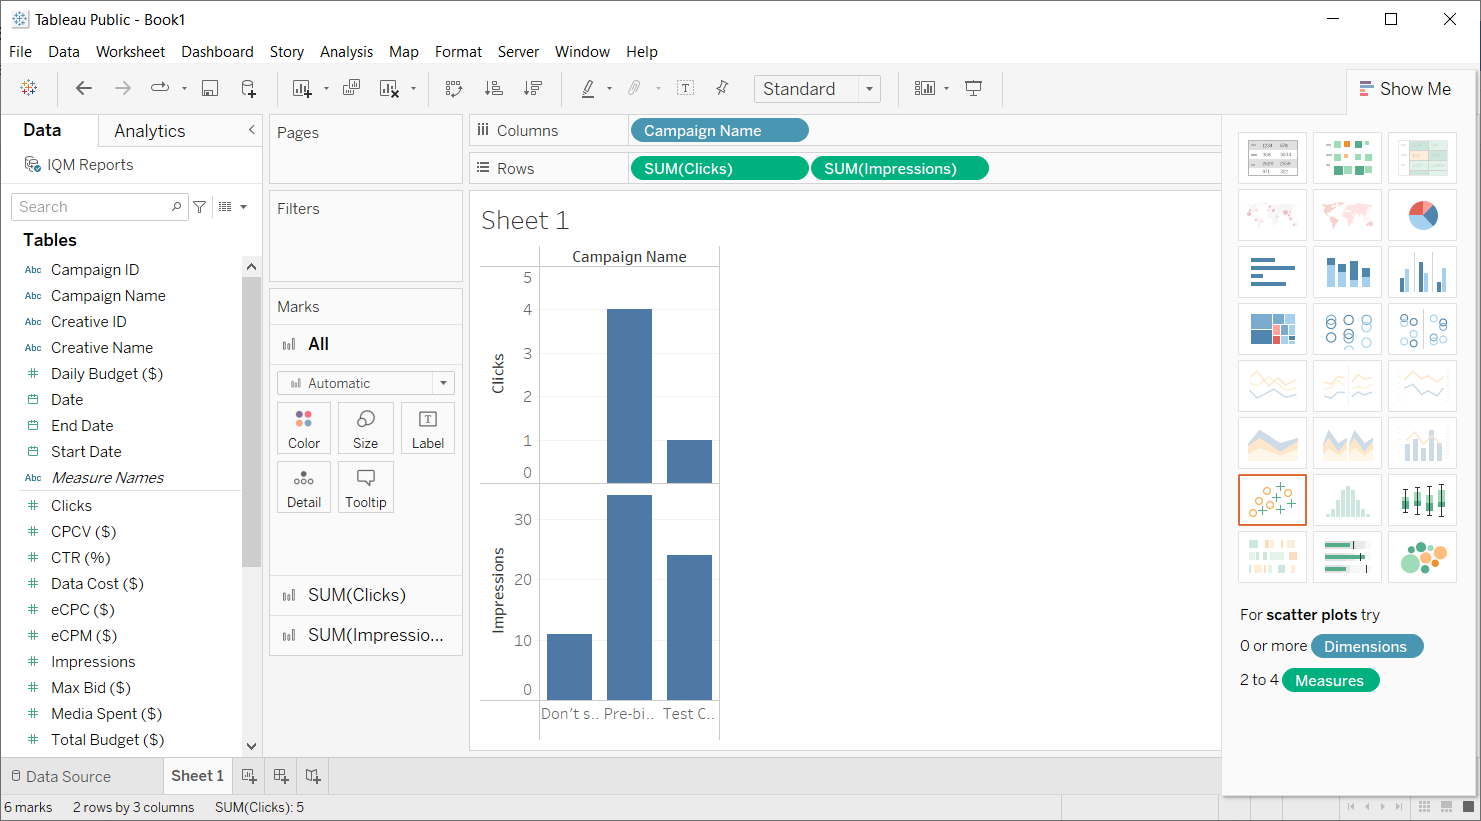
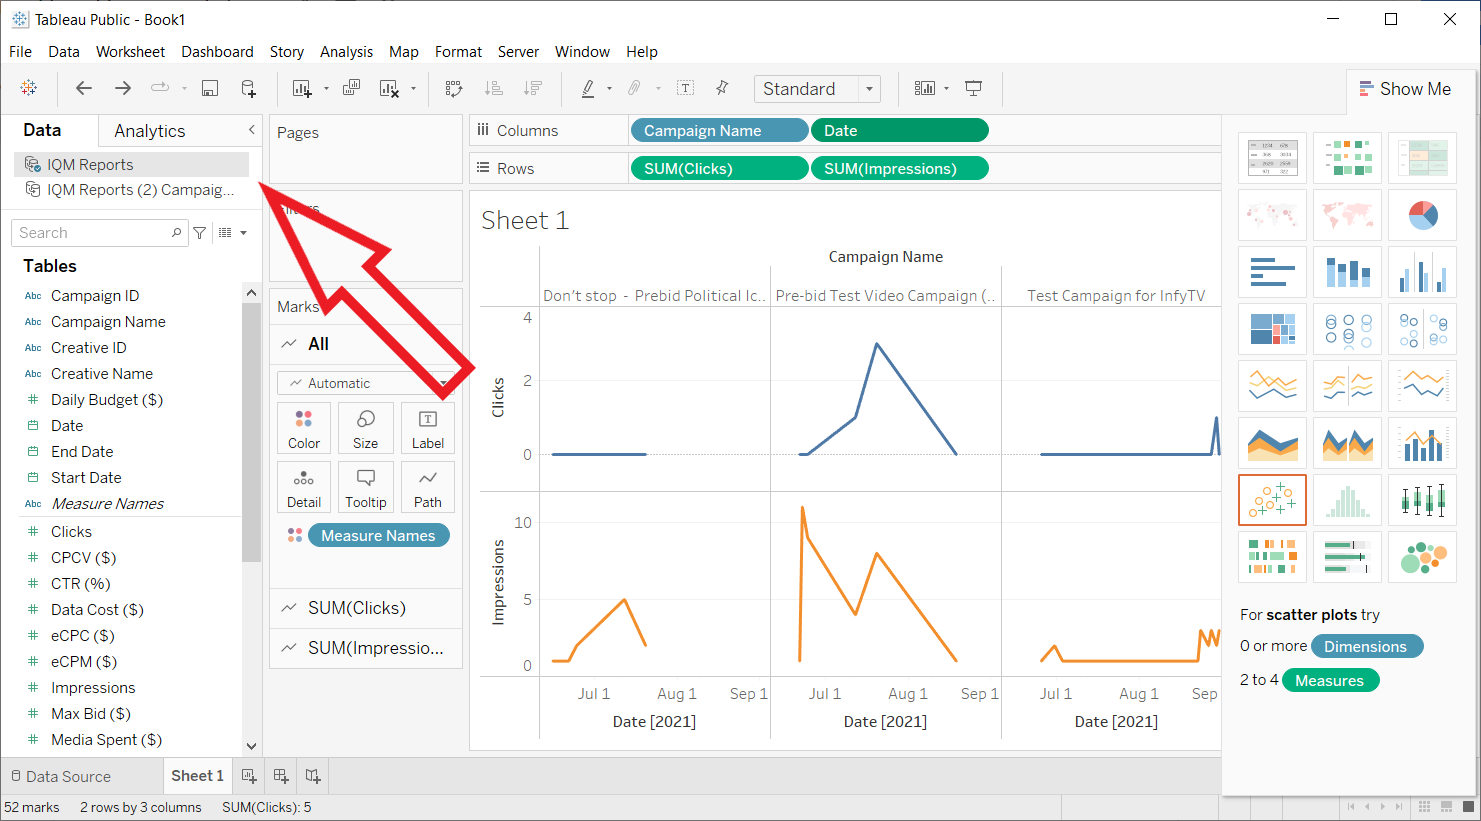
Example: Creating a chart showing clicks and impressions by Campaign:
- Drag Campaign Name to the Columns shelf
- Drag Clicks and Impressions to the Rows shelf
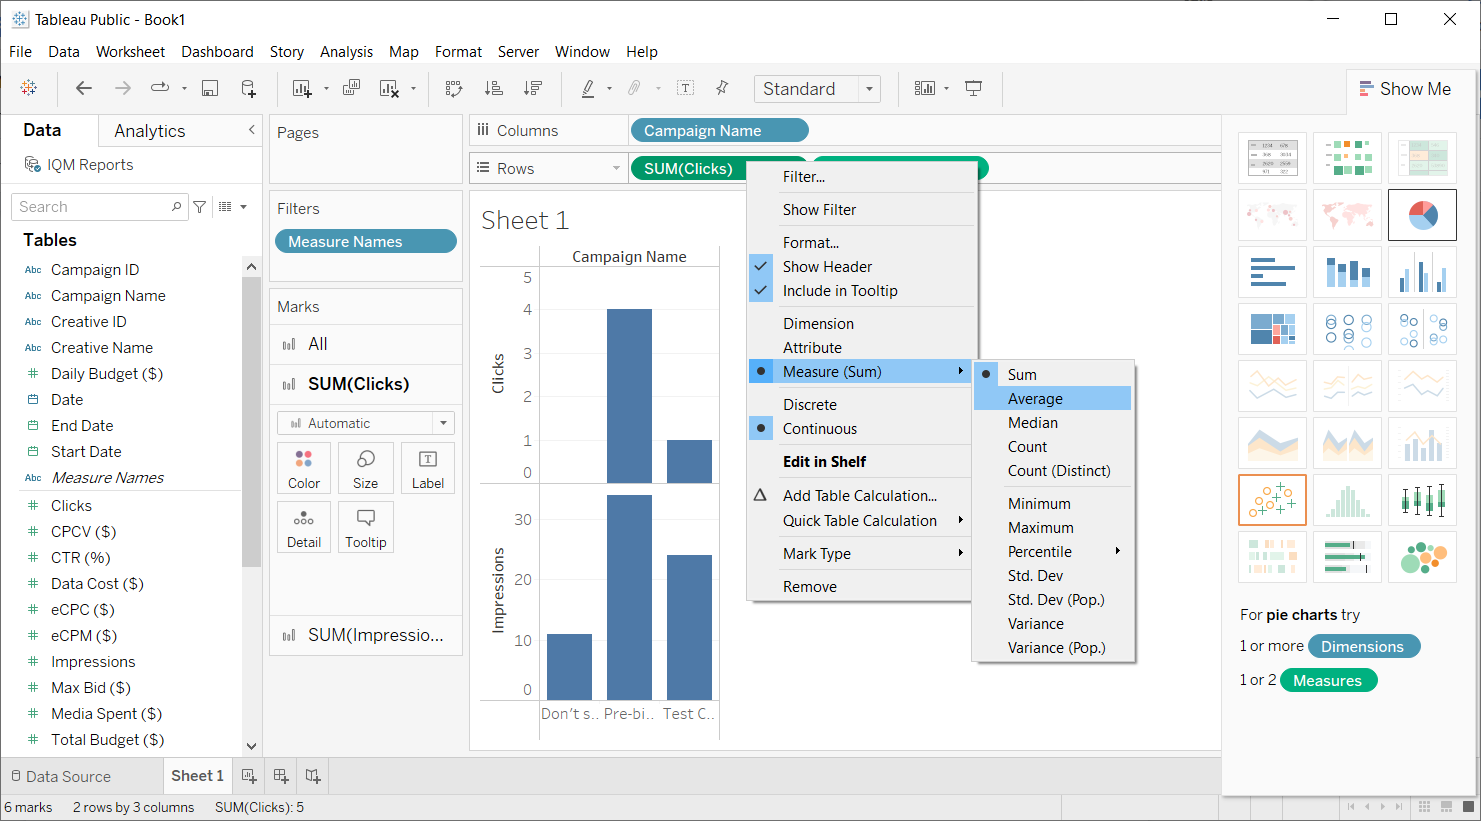
Tableau will automatically aggregate values in a field when appropriate. To change the aggregation type, right-click on the item in the shelf and select Measure, then the type of aggregation to show.
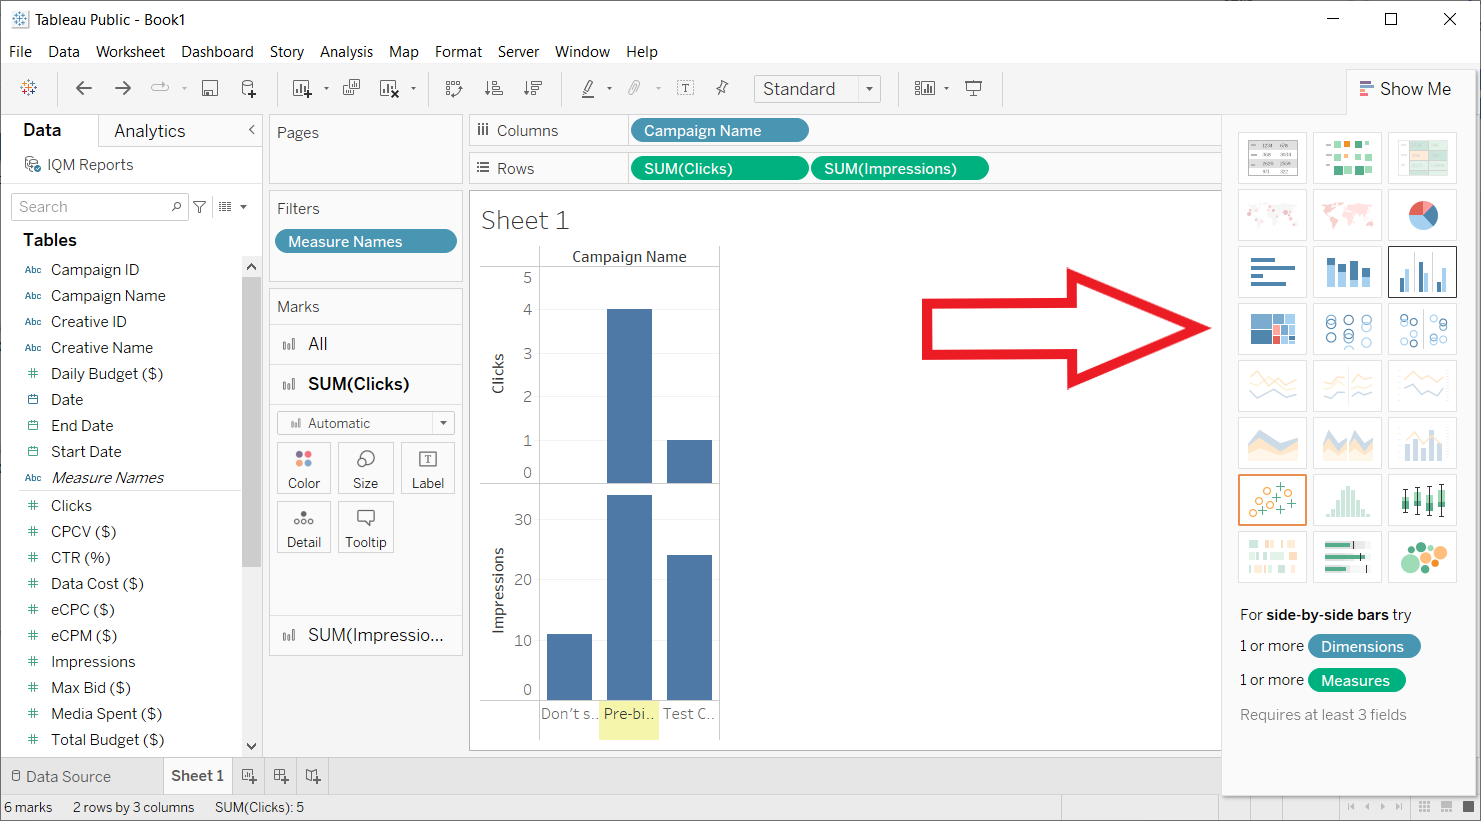
Changing Chart Types
When one or more dimensions or measures are dragged into the data panel, Tableau highlights the available visualization types for the dimension/measure combination in the right Show Me panel. You can change the chart type by selecting an option in this sidebar.
Tableau provides a wide variety of features and has the flexibility to create many types of informative charts and visualizations to showcase and analyze data. For detailed information on creating different visualization types, see Tableau Building Visualizations.
Using Multiple Tables
When editing a data source, Tableau automatically attempts to create relationships between any tables added to the Data Source canvas by combining them on similar columns. Therefore, in order to use multiple tables with distinct Group By dimensions from the IQM Reports WDC, you will need to add a new Data Source for each IQM Reports table.
- Select Data > New Data Source from the top menu bar
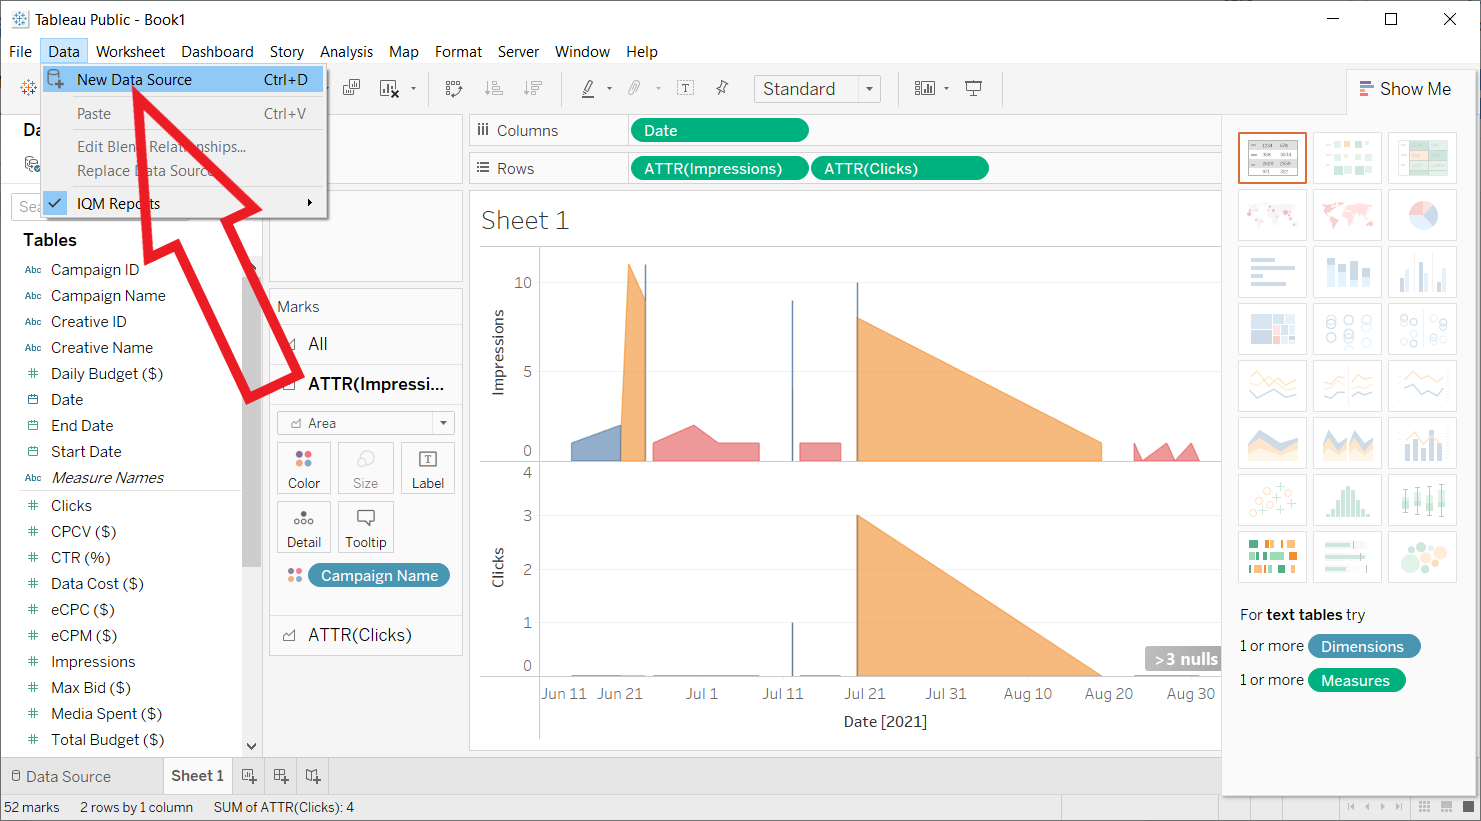
- Select Web Data Connector from the list of connectors
- The familiar Web Data Connector popup will appear. Type in the URL for the IQM Reports WDC (
https://tableau-connector.iqm.com/), log in, and fill out the report parameters just as before
- After the new WDC instance connects, Tableau will navigate to the Data Source page. Create the data source by dragging a table to the Data Source editor
- Rename the new data source by typing into the data source name at the top of the window. Use the data source cylinder icon to switch between data sources
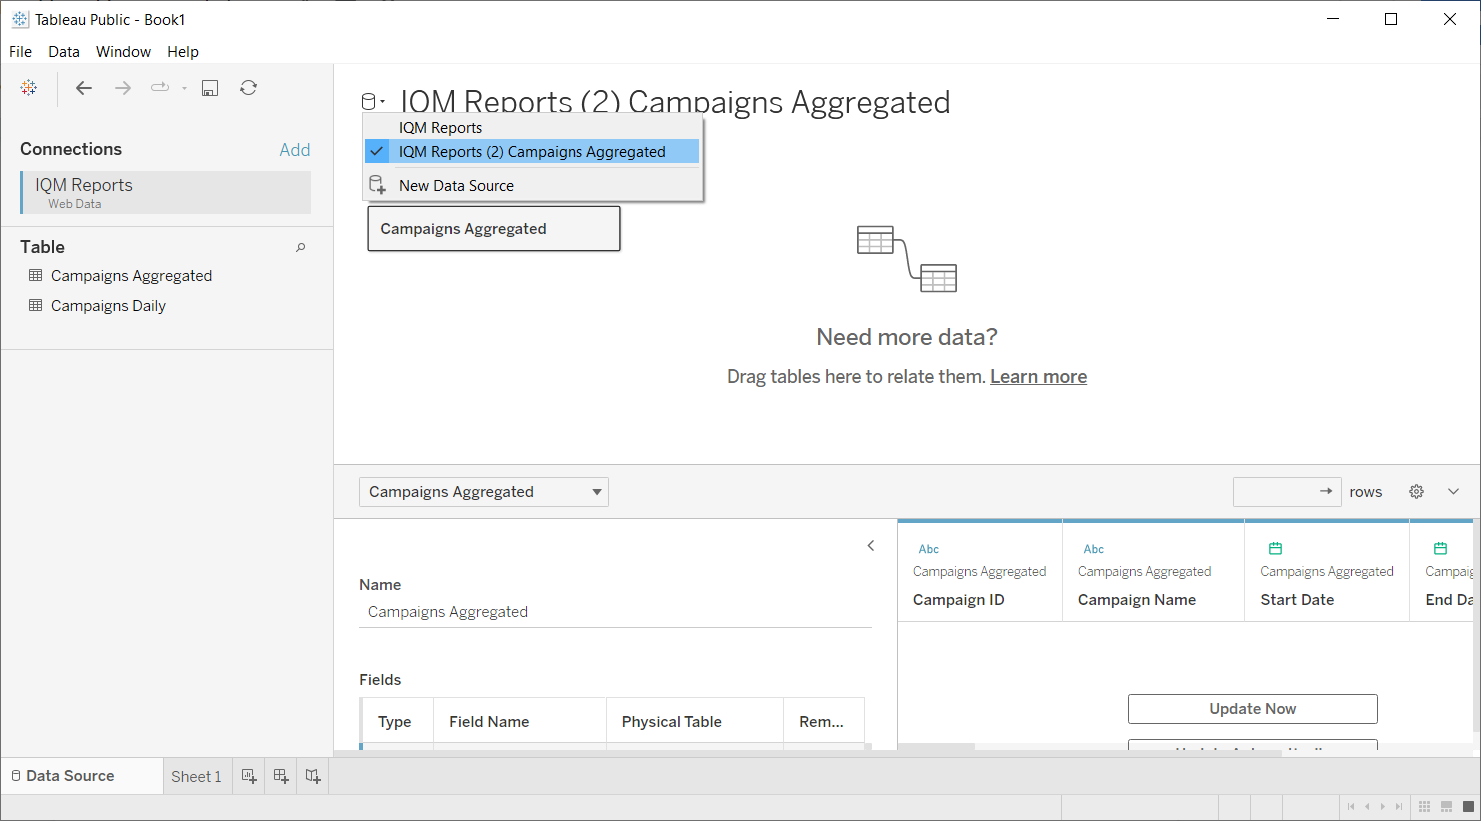
- In each worksheet, switch between data sources in the Data tab of the left sidebar
Use with Tableau Server
To upload data extracts to Tableau Server, your administrator must first allow web data connectors and whitelist the IQM Reports connector.
Administrator Setup
Run the following commands (this will restart the server):
tsm data-access web-data-connectors allow -r true
tsm data-access web-data-connectors add --url https://tableau-connector.iqm.com:443 -n "IQM Web Data Connector"
tsm pending-changes apply
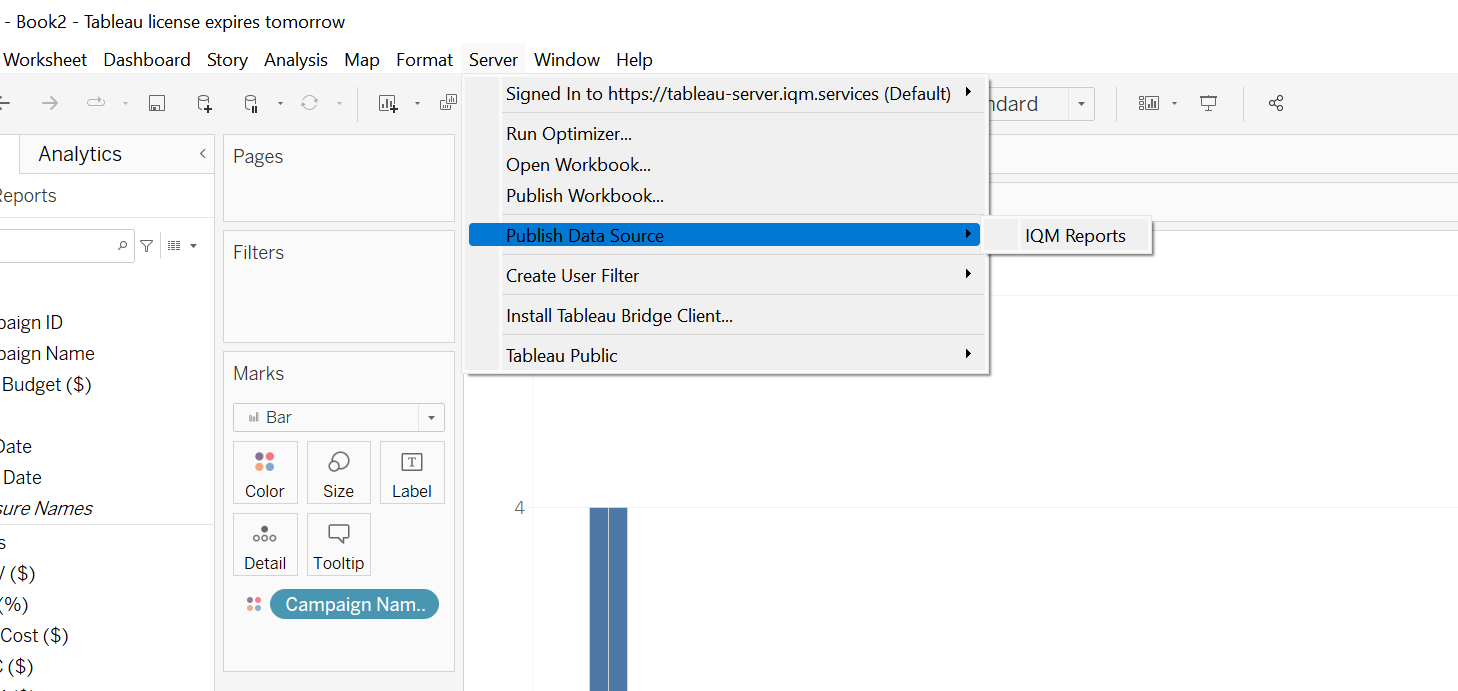
Publishing to Tableau Server
- In Tableau Desktop, select Server > Publish Data Source > IQM Reports
- Set Authentication to Embedded Password
- Click Publish
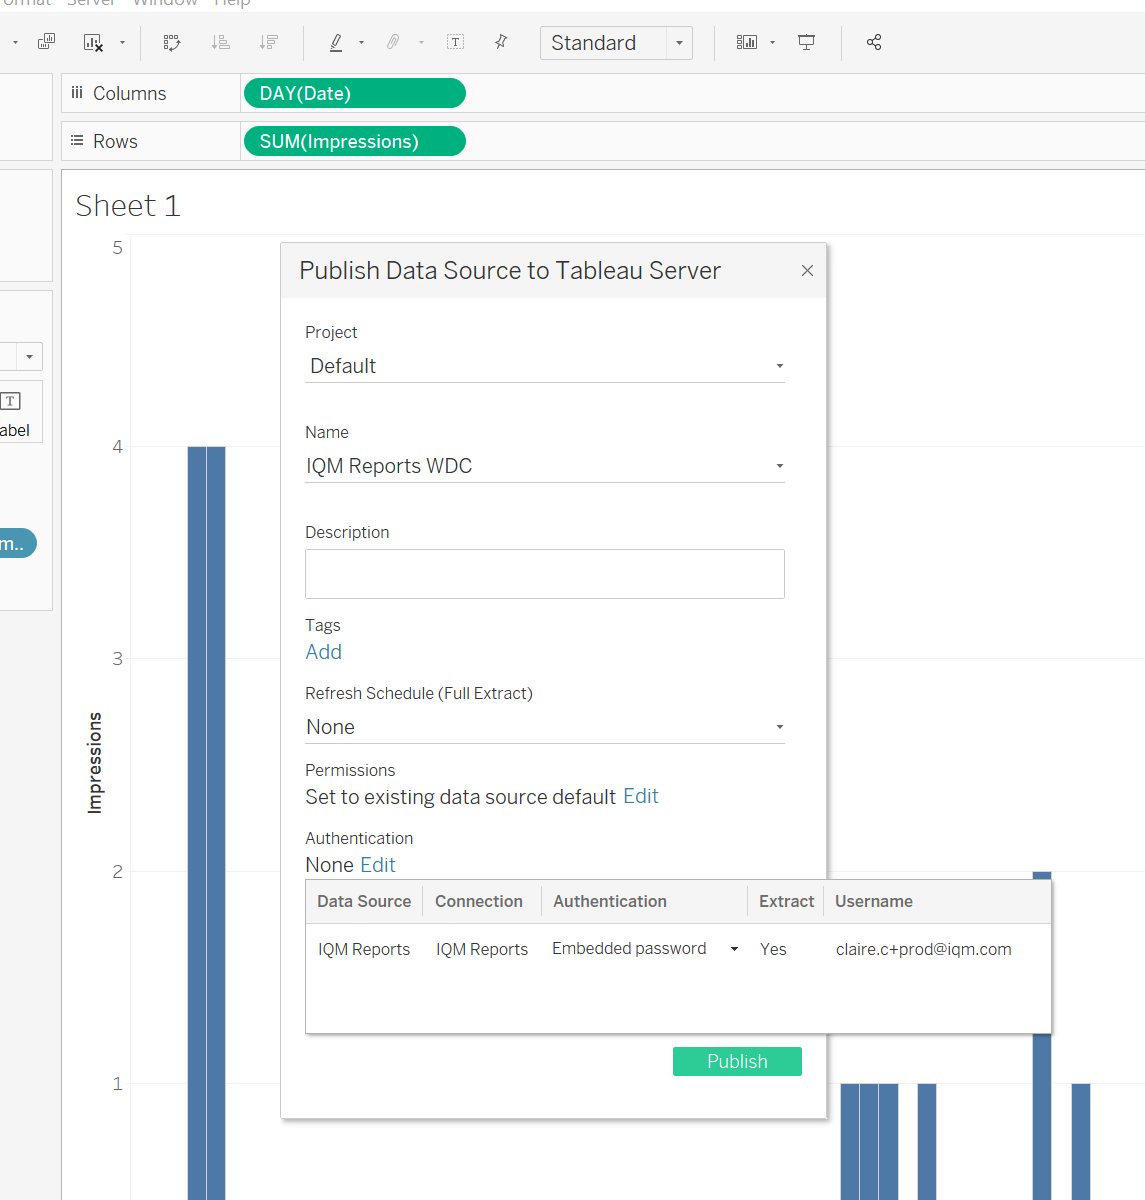
Extracts created from the IQM Reports connector can be refreshed for up to four weeks from the time the data source was created.
For more information on using web data connectors in Tableau Server, see the Official Tableau Documentation.
Additional Resources
- IQM Tableau Connector Portal - Access the connector directly
- Tableau Help - Tableau documentation
- Tableau Data Sources Documentation - Working with data sources
- Tableau Data Fields Types and Roles - Understanding dimensions, measures, discrete, and continuous
- Tableau Building Visualizations - Creating charts
- Tableau Server WDC Documentation - Web data connectors in Tableau Server
- Tableau Community WDC List - Full list of web data connectors
- Tableau Public - Free version
- Tableau Desktop - Full version
- IQM Partnerships - View all IQM partners